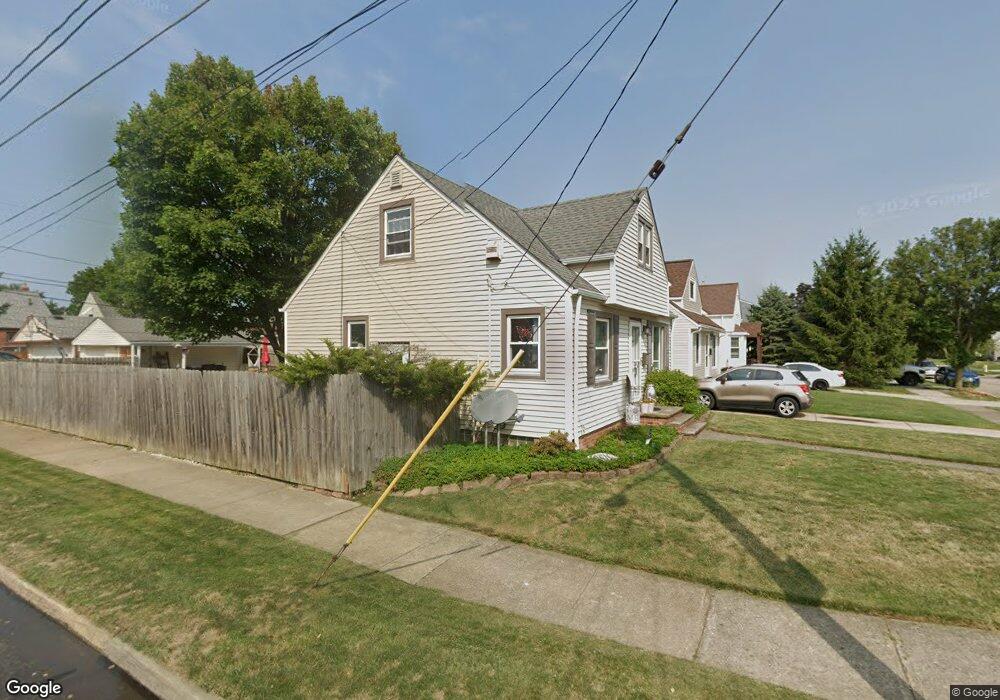
8518 Renwood Dr Cleveland, OH 44129
Estimated Value: $185,000 - $212,000
3
Beds
2
Baths
1,274
Sq Ft
$155/Sq Ft
Est. Value
About This Home
This home is located at 8518 Renwood Dr, Cleveland, OH 44129 and is currently estimated at $198,041, approximately $155 per square foot. 8518 Renwood Dr is a home located in Cuyahoga County with nearby schools including Renwood Elementary School, Thoreau Park Elementary School, and Shiloh Middle School.
Ownership History
Date
Name
Owned For
Owner Type
Purchase Details
Closed on
Dec 15, 2008
Sold by
Trainer Daniel A
Bought by
Trainer Cheryl A
Current Estimated Value
Purchase Details
Closed on
Sep 22, 1995
Sold by
Stakolich Timothy J
Bought by
Trainer Daniel A and Trainer Cheryl A
Home Financials for this Owner
Home Financials are based on the most recent Mortgage that was taken out on this home.
Original Mortgage
$87,875
Interest Rate
7.78%
Mortgage Type
New Conventional
Purchase Details
Closed on
Aug 26, 1988
Sold by
Ohlson John William
Bought by
Stakolich Timothy J
Purchase Details
Closed on
Nov 7, 1979
Sold by
Matula Rudolph S
Bought by
Ohlson John William
Purchase Details
Closed on
Dec 23, 1976
Bought by
Matula Rudolph S
Purchase Details
Closed on
Dec 3, 1976
Sold by
Krzeminski Jos F and Krzeminski Nancy S
Bought by
Russell Realty Company
Purchase Details
Closed on
Jan 1, 1975
Bought by
Krzeminski Jos F and Krzeminski Nancy S
Create a Home Valuation Report for This Property
The Home Valuation Report is an in-depth analysis detailing your home's value as well as a comparison with similar homes in the area
Home Values in the Area
Average Home Value in this Area
Purchase History
| Date | Buyer | Sale Price | Title Company |
|---|---|---|---|
| Trainer Cheryl A | -- | World Class Title Agency Of | |
| Trainer Daniel A | $92,500 | -- | |
| Stakolich Timothy J | $58,500 | -- | |
| Ohlson John William | $52,000 | -- | |
| Matula Rudolph S | $37,500 | -- | |
| Russell Realty Company | $38,000 | -- | |
| Krzeminski Jos F | -- | -- |
Source: Public Records
Mortgage History
| Date | Status | Borrower | Loan Amount |
|---|---|---|---|
| Previous Owner | Trainer Daniel A | $87,875 |
Source: Public Records
Tax History Compared to Growth
Tax History
| Year | Tax Paid | Tax Assessment Tax Assessment Total Assessment is a certain percentage of the fair market value that is determined by local assessors to be the total taxable value of land and additions on the property. | Land | Improvement |
|---|---|---|---|---|
| 2024 | $3,298 | $54,040 | $10,710 | $43,330 |
| 2023 | $3,200 | $45,360 | $9,450 | $35,910 |
| 2022 | $3,169 | $45,360 | $9,450 | $35,910 |
| 2021 | $3,261 | $45,360 | $9,450 | $35,910 |
| 2020 | $2,853 | $34,900 | $7,280 | $27,620 |
| 2019 | $2,732 | $99,700 | $20,800 | $78,900 |
| 2018 | $2,592 | $34,900 | $7,280 | $27,620 |
| 2017 | $2,599 | $30,730 | $6,300 | $24,430 |
| 2016 | $2,583 | $30,730 | $6,300 | $24,430 |
| 2015 | $2,475 | $30,730 | $6,300 | $24,430 |
| 2014 | $2,475 | $31,360 | $6,440 | $24,920 |
Source: Public Records
Map
Nearby Homes
- 8514 Deerfield Dr
- 5972 Westminster Dr
- 5926 Deering Ave
- 5906 Twin Lakes Dr
- 5860 Pearl Rd
- 8017 Wainstead Dr
- 7503 Whittington Dr
- 5845 Lotusdale Dr
- 7514 Spring Garden Rd
- 8017 Ackley Rd
- 7615 Bertha Ave
- 6136 Ridge Rd
- 9304 Snow Rd
- 7619 Snow Rd
- 6108 Pearl Rd
- 10172 Keswick Dr
- 6168 Manchester Rd
- 7115 Hampstead Ave
- 6227 Ridge Rd
- 0 Parkhill Dr Unit 5116837
- 8514 Renwood Dr
- 8510 Renwood Dr
- 8506 Renwood Dr
- 8519 Whittington Dr
- 6066 Westminster Dr
- 8515 Whittington Dr
- 6062 Westminster Dr
- 8511 Whittington Dr
- 6074 Westminster Dr
- 6058 Westminster Dr
- 6078 Westminster Dr
- 8515 Renwood Dr
- 6054 Westminster Dr
- 8511 Renwood Dr
- 6082 Westminster Dr
- 8414 Renwood Dr
- 8503 Whittington Dr
- 8507 Renwood Dr
- 6050 Westminster Dr
- 6086 Westminster Dr