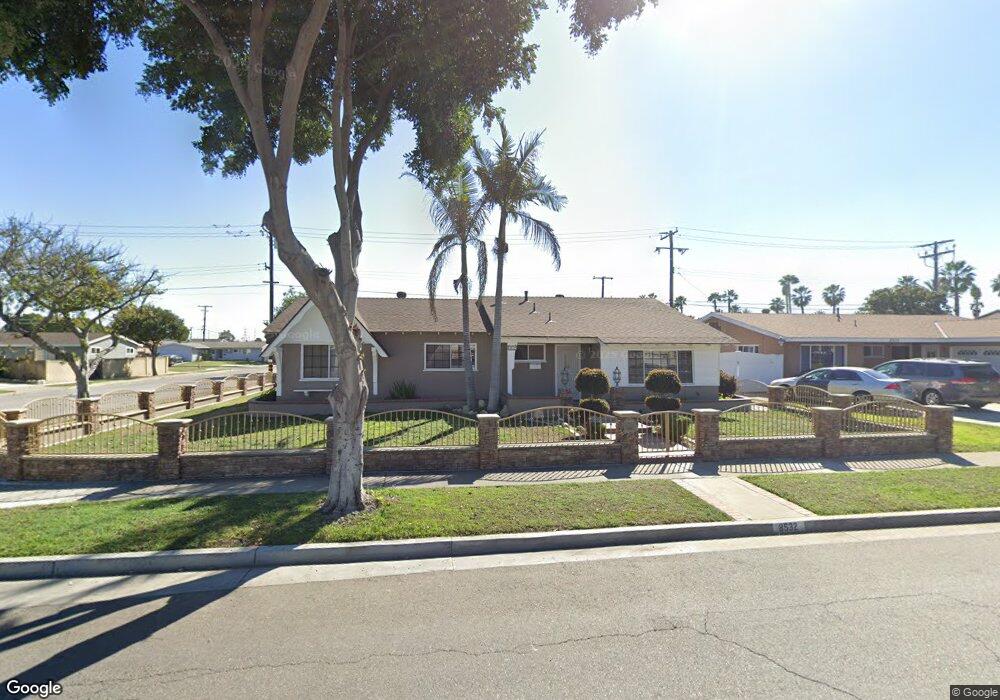
8532 Tamarack Way Buena Park, CA 90620
Estimated Value: $890,229 - $1,039,000
4
Beds
2
Baths
1,552
Sq Ft
$606/Sq Ft
Est. Value
About This Home
This home is located at 8532 Tamarack Way, Buena Park, CA 90620 and is currently estimated at $940,807, approximately $606 per square foot. 8532 Tamarack Way is a home located in Orange County with nearby schools including Glen H. Dysinger Sr. Elementary School, Brookhurst Junior High School, and Savanna High School.
Ownership History
Date
Name
Owned For
Owner Type
Purchase Details
Closed on
Jan 12, 2011
Sold by
Ha Kien Quoc
Bought by
Ha Kien Quoc and Dong Kimberly Ngan
Current Estimated Value
Home Financials for this Owner
Home Financials are based on the most recent Mortgage that was taken out on this home.
Original Mortgage
$210,000
Outstanding Balance
$6,416
Interest Rate
4.62%
Mortgage Type
New Conventional
Estimated Equity
$934,391
Purchase Details
Closed on
Sep 18, 2010
Sold by
Ha Kien Quoc and Dong Kimberly Ngan
Bought by
Ha Kien Quoc
Purchase Details
Closed on
Feb 4, 1999
Sold by
Duc Ha Khuong Quoc and Nguyen Thuy
Bought by
Ha Kien Quoc and Dong Kimberly Ngan
Purchase Details
Closed on
Nov 18, 1993
Sold by
Ha Lan Anh and Ha Yen Phi
Bought by
Ha Khuong Quoc and Nguyen Thuy
Create a Home Valuation Report for This Property
The Home Valuation Report is an in-depth analysis detailing your home's value as well as a comparison with similar homes in the area
Home Values in the Area
Average Home Value in this Area
Purchase History
| Date | Buyer | Sale Price | Title Company |
|---|---|---|---|
| Ha Kien Quoc | -- | Lawyers Title | |
| Ha Kien Quoc | -- | None Available | |
| Ha Kien Quoc | -- | Southland Title Corporation | |
| Ha Khuong Quoc | -- | -- |
Source: Public Records
Mortgage History
| Date | Status | Borrower | Loan Amount |
|---|---|---|---|
| Open | Ha Kien Quoc | $210,000 |
Source: Public Records
Tax History Compared to Growth
Tax History
| Year | Tax Paid | Tax Assessment Tax Assessment Total Assessment is a certain percentage of the fair market value that is determined by local assessors to be the total taxable value of land and additions on the property. | Land | Improvement |
|---|---|---|---|---|
| 2025 | $3,259 | $264,192 | $183,046 | $81,146 |
| 2024 | $3,259 | $259,012 | $179,457 | $79,555 |
| 2023 | $3,177 | $253,934 | $175,938 | $77,996 |
| 2022 | $3,135 | $248,955 | $172,488 | $76,467 |
| 2021 | $3,091 | $244,074 | $169,106 | $74,968 |
| 2020 | $3,072 | $241,572 | $167,372 | $74,200 |
| 2019 | $2,999 | $236,836 | $164,090 | $72,746 |
| 2018 | $2,946 | $232,193 | $160,873 | $71,320 |
| 2017 | $2,857 | $227,641 | $157,719 | $69,922 |
| 2016 | $2,804 | $223,178 | $154,627 | $68,551 |
| 2015 | $2,773 | $219,826 | $152,304 | $67,522 |
| 2014 | $2,638 | $215,520 | $149,320 | $66,200 |
Source: Public Records
Map
Nearby Homes
- 8054 Teakwood Cir
- 8319 Hickory Dr
- 8434 Periwinkle Dr
- 605 N La Reina St
- 21 Centerstone Cir
- 2625 W Cameron Ct Unit 121
- 8452 Stanton Ave
- 400 N Syracuse St
- 2544 W Greenacre Ave
- 2709 W Madison Cir
- 1006 N Hampton Place
- 2697 W Parkside Ln
- 8026 Carnation Dr
- 2955 W Lincoln Ave Unit 7
- 1028 N Mayflower St
- 8194 Calendula Dr
- 2871 W Tyler Ave
- 199 N Magnolia Ave Unit B
- 8133 Canterbury Way
- 2943 W Lincoln Ave
- 8522 Tamarack Way
- 8091 Hickory Dr
- 8552 Tamarack Way
- 8103 Hickory Dr
- 8512 Tamarack Way
- 8567 Hollyoak St
- 8531 Tamarack Way
- 8092 Dale St
- 8541 Tamarack Way
- 8521 Tamarack Way
- 8551 Tamarack Way
- 8562 Tamarack Way
- 8115 Hickory Dr
- 8104 Dale St
- 8579 Hollyoak St
- 8511 Tamarack Way
- 8561 Tamarack Way
- 8572 Tamarack Way
- 8116 Dale St
- 8127 Hickory Dr