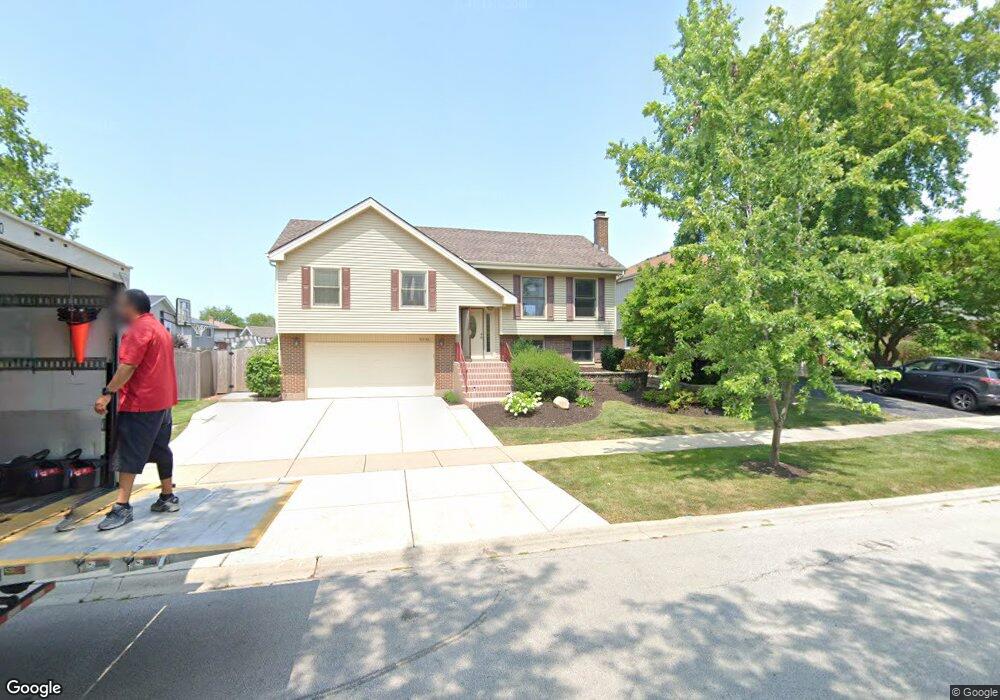
8536 Carriage Ln Tinley Park, IL 60487
Central Tinley Park NeighborhoodEstimated Value: $385,836 - $419,000
3
Beds
2
Baths
1,833
Sq Ft
$220/Sq Ft
Est. Value
About This Home
This home is located at 8536 Carriage Ln, Tinley Park, IL 60487 and is currently estimated at $403,709, approximately $220 per square foot. 8536 Carriage Ln is a home located in Cook County with nearby schools including Christa Mcauliffe School, Prairie View Middle School, and Victor J Andrew High School.
Ownership History
Date
Name
Owned For
Owner Type
Purchase Details
Closed on
Jul 18, 2023
Sold by
Murabito Ronald E and Murabito Stacey
Bought by
Murabito Family Trust and Murabito
Current Estimated Value
Purchase Details
Closed on
Jul 24, 2013
Sold by
Mcqueary David P and Mcqueary Stacey
Bought by
Murabito Ronald E and Murabito Stacey
Home Financials for this Owner
Home Financials are based on the most recent Mortgage that was taken out on this home.
Original Mortgage
$227,950
Interest Rate
4.5%
Mortgage Type
New Conventional
Purchase Details
Closed on
Jul 7, 2004
Sold by
Mcqufary David P and Mcqufary Stacey
Bought by
Mcqufary David P and Mcqufary Stacey
Purchase Details
Closed on
Jun 14, 2002
Sold by
Baloch Ghulam S and Baloch Zareen
Bought by
Mcqueary David P and Mcqueary Stacey A
Home Financials for this Owner
Home Financials are based on the most recent Mortgage that was taken out on this home.
Original Mortgage
$158,100
Interest Rate
6.39%
Create a Home Valuation Report for This Property
The Home Valuation Report is an in-depth analysis detailing your home's value as well as a comparison with similar homes in the area
Home Values in the Area
Average Home Value in this Area
Purchase History
| Date | Buyer | Sale Price | Title Company |
|---|---|---|---|
| Murabito Family Trust | -- | None Listed On Document | |
| Murabito Ronald E | $235,000 | Pntn | |
| Mcqufary David P | -- | -- | |
| Mcqueary David P | $186,000 | -- |
Source: Public Records
Mortgage History
| Date | Status | Borrower | Loan Amount |
|---|---|---|---|
| Previous Owner | Murabito Ronald E | $227,950 | |
| Previous Owner | Mcqueary David P | $158,100 | |
| Closed | Mcqueary David P | $5,000 |
Source: Public Records
Tax History Compared to Growth
Tax History
| Year | Tax Paid | Tax Assessment Tax Assessment Total Assessment is a certain percentage of the fair market value that is determined by local assessors to be the total taxable value of land and additions on the property. | Land | Improvement |
|---|---|---|---|---|
| 2024 | $7,964 | $32,000 | $5,175 | $26,825 |
| 2023 | $6,523 | $32,000 | $5,175 | $26,825 |
| 2022 | $6,523 | $21,718 | $4,500 | $17,218 |
| 2021 | $6,345 | $21,718 | $4,500 | $17,218 |
| 2020 | $6,256 | $21,718 | $4,500 | $17,218 |
| 2019 | $6,527 | $23,555 | $4,050 | $19,505 |
| 2018 | $6,385 | $23,555 | $4,050 | $19,505 |
| 2017 | $6,234 | $23,555 | $4,050 | $19,505 |
| 2016 | $6,473 | $21,988 | $3,600 | $18,388 |
| 2015 | $6,363 | $21,988 | $3,600 | $18,388 |
| 2014 | $6,326 | $21,988 | $3,600 | $18,388 |
| 2013 | $5,409 | $20,539 | $3,600 | $16,939 |
Source: Public Records
Map
Nearby Homes
- 8543 Carriage Ln
- 8548 Bethany Ln
- 17155 Kamp Ct Unit 9
- 17324 Humber Ln
- 8456 170th Place
- 8444 W 171st St
- 8721 W 169th St
- Fremont Plan at Radcliffe Place
- Calysta Plan at Radcliffe Place
- Danbury Plan at Radcliffe Place
- Briarcliffe Plan at Radcliffe Place
- Eden Plan at Radcliffe Place
- Amberwood Plan at Radcliffe Place
- 8229 170th St Unit 8229
- 8750 W 169th St
- 8313 Aster Ln
- 16933 Richards Dr
- 17230 Shetland Dr
- 8710 W 168th St
- 17631 Dover Ct
- 8530 Carriage Ln
- 17231 Valley Dr
- 17237 Valley Dr
- 8524 Carriage Ln
- 17225 Valley Dr
- 8543 Bethany Ln
- 8537 Bethany Ln
- 8518 Carriage Ln
- 17219 Valley Dr
- 8531 Bethany Ln
- 8531 Carriage Ln
- 8537 Carriage Ln
- 8512 Carriage Ln
- 8519 Carriage Ln
- 17200 Fox Grove Ln
- 17155 Bethany Ln
- 17238 Valley Dr
- 17226 Valley Dr
- 17210 Fox Grove Ln
- 8601 Bethany Ln