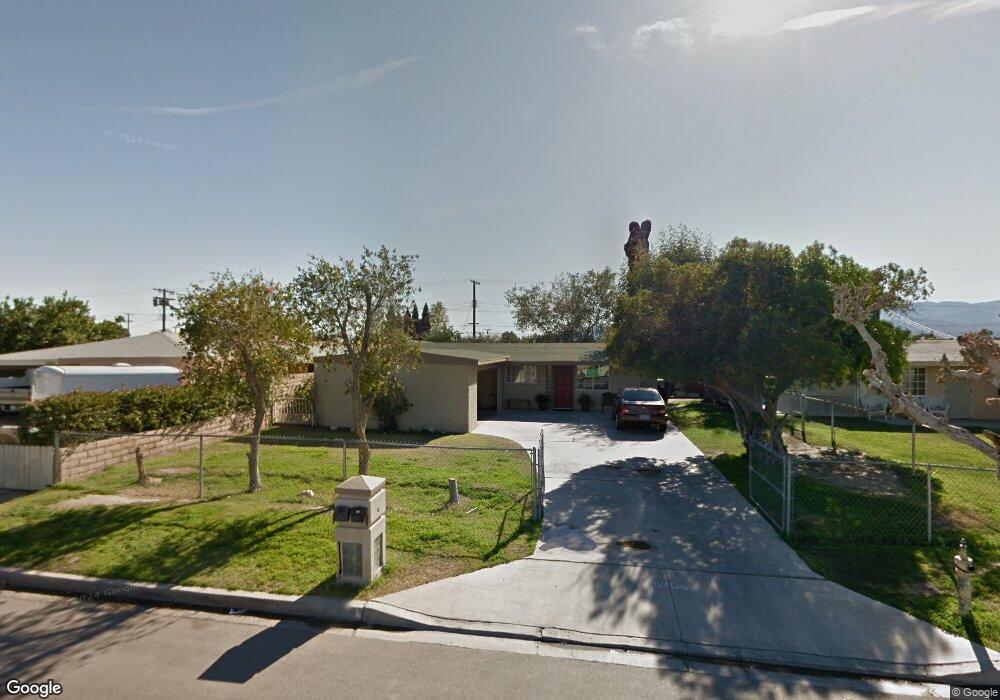
85406 Araby Ave Coachella, CA 92236
Estimated Value: $239,000 - $360,000
3
Beds
2
Baths
1,080
Sq Ft
$295/Sq Ft
Est. Value
About This Home
This home is located at 85406 Araby Ave, Coachella, CA 92236 and is currently estimated at $318,544, approximately $294 per square foot. 85406 Araby Ave is a home located in Riverside County with nearby schools including Palm View Elementary School, Bobby Duke Middle School, and Coachella Valley High School.
Ownership History
Date
Name
Owned For
Owner Type
Purchase Details
Closed on
Nov 4, 2020
Sold by
Nava Guillermo and Nava Gerrardo
Bought by
Nava Gerrardo and Nava Maria Christina
Current Estimated Value
Home Financials for this Owner
Home Financials are based on the most recent Mortgage that was taken out on this home.
Original Mortgage
$125,000
Interest Rate
2.7%
Mortgage Type
New Conventional
Purchase Details
Closed on
Feb 2, 2019
Sold by
Nava Maria Christina Rodriguez
Bought by
Nava Gerardo
Purchase Details
Closed on
Jun 10, 2003
Sold by
Nava Jose G and Nava Guadalupe
Bought by
Nava Guadalupe
Home Financials for this Owner
Home Financials are based on the most recent Mortgage that was taken out on this home.
Original Mortgage
$50,000
Interest Rate
5.53%
Mortgage Type
Purchase Money Mortgage
Create a Home Valuation Report for This Property
The Home Valuation Report is an in-depth analysis detailing your home's value as well as a comparison with similar homes in the area
Home Values in the Area
Average Home Value in this Area
Purchase History
| Date | Buyer | Sale Price | Title Company |
|---|---|---|---|
| Nava Gerrardo | -- | Orange Coast Title | |
| Nava Gerardo | -- | None Available | |
| Nava Guillermo | -- | None Available | |
| Nava Guadalupe | -- | None Available | |
| Nava Guadalupe | -- | Diversified Title & Escrow S |
Source: Public Records
Mortgage History
| Date | Status | Borrower | Loan Amount |
|---|---|---|---|
| Previous Owner | Nava Gerrardo | $125,000 | |
| Previous Owner | Nava Guadalupe | $50,000 |
Source: Public Records
Tax History Compared to Growth
Tax History
| Year | Tax Paid | Tax Assessment Tax Assessment Total Assessment is a certain percentage of the fair market value that is determined by local assessors to be the total taxable value of land and additions on the property. | Land | Improvement |
|---|---|---|---|---|
| 2025 | $2,866 | $135,606 | $20,339 | $115,267 |
| 2023 | $2,866 | $130,342 | $19,550 | $110,792 |
| 2022 | $2,746 | $127,787 | $19,167 | $108,620 |
| 2021 | $2,689 | $125,283 | $18,792 | $106,491 |
| 2020 | $1,632 | $55,858 | $8,249 | $47,609 |
| 2019 | $1,575 | $54,764 | $8,088 | $46,676 |
| 2018 | $1,529 | $53,691 | $7,930 | $45,761 |
| 2017 | $1,465 | $52,639 | $7,775 | $44,864 |
| 2016 | $1,414 | $51,608 | $7,623 | $43,985 |
| 2015 | $1,377 | $50,834 | $7,509 | $43,325 |
| 2014 | $869 | $49,840 | $7,363 | $42,477 |
Source: Public Records
Map
Nearby Homes
- 52066 Channing Ct
- 83904 52nd Ave
- 0 52nd Ave Unit 219131177DA
- 51812 Sunset Dr
- 50529 Grapefruit Blvd
- 53175 Cesar Chavez St
- 53049 Cesar Chavez St
- 0 Damascus Ave
- 52313 Calle Alicia
- 85675 Michelle Dr
- 0 Palm Ave
- 1449 3rd St
- 53079 Cesar Chavez St
- 52717 Calle Techa
- 1423 2nd St
- 52560 Tyler St
- 437 Vine Ave
- 50442 S Kenmore St
- 85158 Avenida Tacuba
- 86101 Corte Olivia
- 85416 Araby Ave
- 85396 Araby Ave
- 85386 Araby Ave
- 85426 Araby Ave
- 85405 Avenue 52
- 85415 Avenue 52
- 85395 Avenue 52
- 85376 Araby Ave
- 85385 Avenue 52
- 85436 Araby Ave
- 85425 Avenue 52
- 85405 Araby Ave
- 85395 Araby Ave
- 85415 Araby Ave
- 85385 Araby Ave
- 85375 Avenue 52
- 85435 Avenue 52
- 85366 Araby Ave
- 85446 Araby Ave
- 85425 Araby Ave