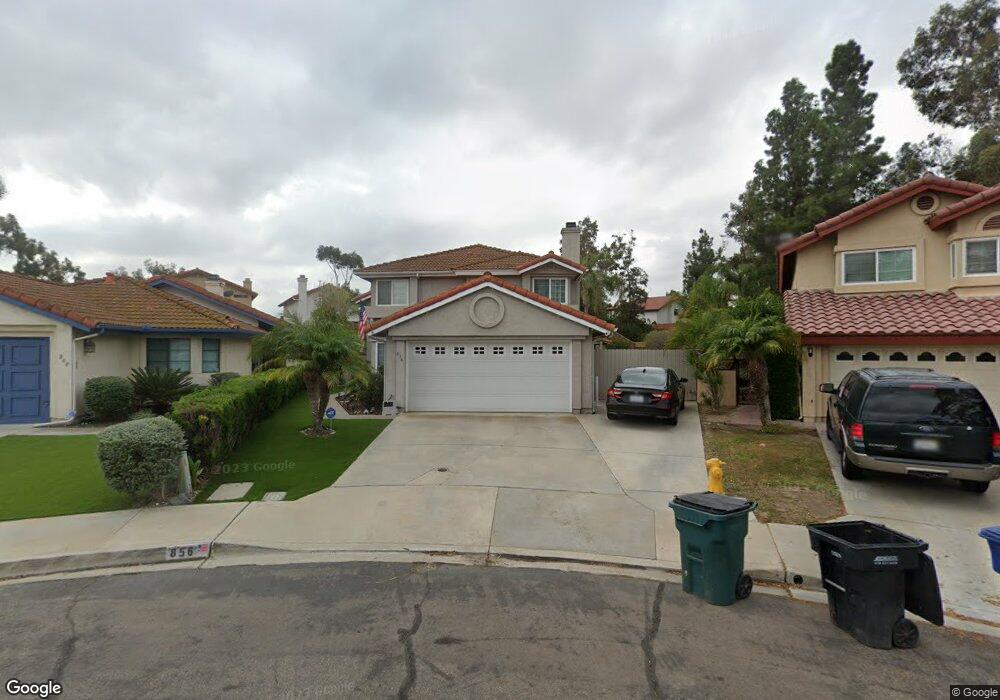
856 Gold Oak Ct Chula Vista, CA 91910
Rancho Del Rey NeighborhoodEstimated Value: $912,000 - $964,000
3
Beds
3
Baths
1,889
Sq Ft
$496/Sq Ft
Est. Value
About This Home
This home is located at 856 Gold Oak Ct, Chula Vista, CA 91910 and is currently estimated at $936,548, approximately $495 per square foot. 856 Gold Oak Ct is a home located in San Diego County with nearby schools including Casillas Elementary School, Rancho Del Rey Middle School, and Otay Ranch Senior High School.
Ownership History
Date
Name
Owned For
Owner Type
Purchase Details
Closed on
Jul 6, 2015
Sold by
Sanchez Robert and Sanchez Diana
Bought by
Hagerty Timothy and Hagerty Yvonne
Current Estimated Value
Home Financials for this Owner
Home Financials are based on the most recent Mortgage that was taken out on this home.
Original Mortgage
$522,650
Outstanding Balance
$409,233
Interest Rate
3.98%
Mortgage Type
VA
Estimated Equity
$527,315
Purchase Details
Closed on
Apr 8, 2002
Sold by
Sanchez Robert B and Sanchez Cecilia G
Bought by
Sanchez Robert and Sanchez Diana
Home Financials for this Owner
Home Financials are based on the most recent Mortgage that was taken out on this home.
Original Mortgage
$210,000
Interest Rate
6.87%
Purchase Details
Closed on
Feb 17, 1999
Sold by
Fisher Robert S
Bought by
Sanchez Robert B and Sanchez Cecilia G
Home Financials for this Owner
Home Financials are based on the most recent Mortgage that was taken out on this home.
Original Mortgage
$213,498
Interest Rate
7.1%
Mortgage Type
FHA
Purchase Details
Closed on
May 30, 1986
Create a Home Valuation Report for This Property
The Home Valuation Report is an in-depth analysis detailing your home's value as well as a comparison with similar homes in the area
Home Values in the Area
Average Home Value in this Area
Purchase History
| Date | Buyer | Sale Price | Title Company |
|---|---|---|---|
| Hagerty Timothy | $506,000 | Chicago Title Co San Diego | |
| Sanchez Robert | -- | South Coast Title Company | |
| Sanchez Robert B | $224,000 | First American Title Ins Co | |
| -- | $140,000 | -- |
Source: Public Records
Mortgage History
| Date | Status | Borrower | Loan Amount |
|---|---|---|---|
| Open | Hagerty Timothy | $522,650 | |
| Previous Owner | Sanchez Robert | $210,000 | |
| Previous Owner | Sanchez Robert B | $213,498 |
Source: Public Records
Tax History Compared to Growth
Tax History
| Year | Tax Paid | Tax Assessment Tax Assessment Total Assessment is a certain percentage of the fair market value that is determined by local assessors to be the total taxable value of land and additions on the property. | Land | Improvement |
|---|---|---|---|---|
| 2025 | $5,099 | $598,993 | $200,548 | $398,445 |
| 2024 | $5,099 | $587,249 | $196,616 | $390,633 |
| 2023 | $5,089 | $575,735 | $192,761 | $382,974 |
| 2022 | $5,035 | $564,447 | $188,982 | $375,465 |
| 2021 | $4,916 | $553,380 | $185,277 | $368,103 |
| 2020 | $4,832 | $547,707 | $183,378 | $364,329 |
| 2019 | $6,227 | $536,969 | $179,783 | $357,186 |
| 2018 | $6,127 | $526,441 | $176,258 | $350,183 |
| 2017 | $5,998 | $516,119 | $172,802 | $343,317 |
| 2016 | $5,850 | $506,000 | $169,414 | $336,586 |
| 2015 | $3,499 | $292,177 | $97,824 | $194,353 |
| 2014 | $3,430 | $286,454 | $95,908 | $190,546 |
Source: Public Records
Map
Nearby Homes
- 1029 Vista Oak Place
- 820 Chervil Ct
- 1002 Cholla Place
- 1057 Paseo Del Norte
- 909 Loma View
- 843 Calle Ciela Vista Unit 20
- 1008 Calma Dr
- 694 Calma Place
- 1060 Via Sinuoso
- 1075 Hayuco Plaza
- 1112 Camino Del Rey
- 1337 Santa Olivia Rd
- 793 Vada St Unit 2
- 1175 Santa Olivia Rd
- 578 Nantucket Dr
- 728 Cardona Ave
- 713 Esla Dr
- 626 Mariposa Cir
- 640 E J St
- 1181 De Soto Ct Unit 54
- 852 Gold Oak Ct
- 860 Gold Oak Ct
- 859 Blackwood Rd
- 857 Blackwood Rd
- 861 Blackwood Rd
- 862 Gold Oak Ct
- 863 Blackwood Rd
- 866 Gold Oak Ct
- 867 Blackwood Rd
- 853 Blackwood Rd
- 870 Gold Oak Ct
- 867 Gold Oak Ct
- 871 Blackwood Rd
- 851 Blackwood Rd
- 871 Gold Oak Ct
- 856 Blackwood Rd
- 872 Gold Oak Ct
- 860 Blackwood Rd
- 873 Blackwood Rd
- 852 Blackwood Rd