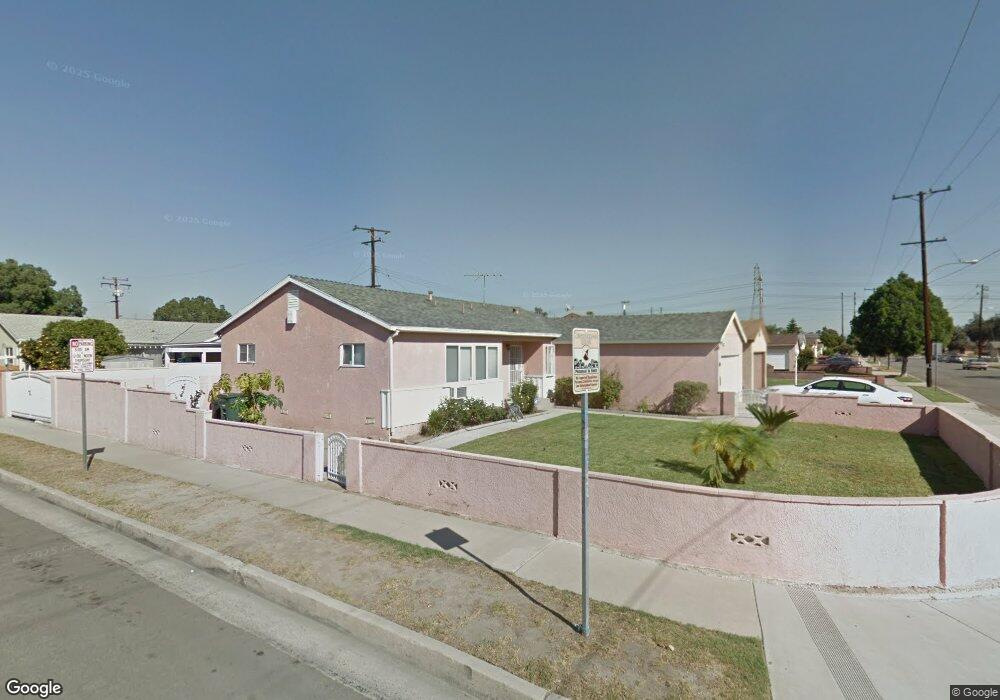
8567 Crescent Ave Buena Park, CA 90620
Estimated Value: $729,000 - $869,000
3
Beds
2
Baths
1,171
Sq Ft
$694/Sq Ft
Est. Value
About This Home
This home is located at 8567 Crescent Ave, Buena Park, CA 90620 and is currently estimated at $812,980, approximately $694 per square foot. 8567 Crescent Ave is a home located in Orange County with nearby schools including Dr. Peter Marshall Elementary School, Brookhurst Junior High School, and Savanna High School.
Ownership History
Date
Name
Owned For
Owner Type
Purchase Details
Closed on
Apr 23, 2009
Sold by
Bank Of New York
Bought by
Ghuman Surjit S and Ghuman Karamjit K
Current Estimated Value
Home Financials for this Owner
Home Financials are based on the most recent Mortgage that was taken out on this home.
Original Mortgage
$265,821
Outstanding Balance
$166,774
Interest Rate
4.8%
Mortgage Type
FHA
Estimated Equity
$646,206
Purchase Details
Closed on
Jul 11, 2008
Sold by
Interrante Mitchell L and Interrante Lori A
Bought by
Bank Of New York and Cwabs 2005-Bc2
Purchase Details
Closed on
Jul 28, 1998
Sold by
Morris Roberta Lee Est Of
Bought by
Interrante Mitchell L and Interrante Lori A
Home Financials for this Owner
Home Financials are based on the most recent Mortgage that was taken out on this home.
Original Mortgage
$146,250
Interest Rate
8.87%
Create a Home Valuation Report for This Property
The Home Valuation Report is an in-depth analysis detailing your home's value as well as a comparison with similar homes in the area
Home Values in the Area
Average Home Value in this Area
Purchase History
| Date | Buyer | Sale Price | Title Company |
|---|---|---|---|
| Ghuman Surjit S | $275,000 | Landsafe Title | |
| Bank Of New York | $288,000 | Landsafe Title | |
| Interrante Mitchell L | $162,500 | South Coast Title Company |
Source: Public Records
Mortgage History
| Date | Status | Borrower | Loan Amount |
|---|---|---|---|
| Open | Ghuman Surjit S | $265,821 | |
| Previous Owner | Interrante Mitchell L | $146,250 |
Source: Public Records
Tax History Compared to Growth
Tax History
| Year | Tax Paid | Tax Assessment Tax Assessment Total Assessment is a certain percentage of the fair market value that is determined by local assessors to be the total taxable value of land and additions on the property. | Land | Improvement |
|---|---|---|---|---|
| 2025 | $4,146 | $354,125 | $285,004 | $69,121 |
| 2024 | $4,146 | $347,182 | $279,416 | $67,766 |
| 2023 | $4,038 | $340,375 | $273,937 | $66,438 |
| 2022 | $3,997 | $333,701 | $268,565 | $65,136 |
| 2021 | $3,950 | $327,158 | $263,299 | $63,859 |
| 2020 | $3,928 | $323,804 | $260,599 | $63,205 |
| 2019 | $3,833 | $317,455 | $255,489 | $61,966 |
| 2018 | $3,787 | $311,231 | $250,480 | $60,751 |
| 2017 | $3,655 | $305,129 | $245,569 | $59,560 |
| 2016 | $3,638 | $299,147 | $240,754 | $58,393 |
| 2015 | $3,602 | $294,654 | $237,138 | $57,516 |
| 2014 | $3,423 | $288,883 | $232,493 | $56,390 |
Source: Public Records
Map
Nearby Homes
- 8319 Hickory Dr
- 605 N La Reina St
- 400 N Syracuse St
- 2709 W Madison Cir
- 2625 W Cameron Ct Unit 121
- 2955 W Lincoln Ave Unit 7
- 8054 Teakwood Cir
- 2871 W Tyler Ave
- 199 N Magnolia Ave Unit B
- 8452 Stanton Ave
- 2544 W Greenacre Ave
- 2770 W Lincoln Ave Unit 40
- 2770 W Lincoln Ave Unit 58
- 2943 W Lincoln Ave
- 8434 Periwinkle Dr
- Plan Two at Mason
- Plan Four at Mason
- Plan Three at Mason
- Plan Seven at Mason
- 109 S Laxore St
- 8579 Crescent Ave
- 8568 Holly Way
- 8574 Holly Way
- 537 N Colgate St
- 8499 Hickory Dr
- 8487 Hickory Dr
- 8580 Holly Way
- 8475 Hickory Dr
- 8603 Crescent Ave
- 531 N Colgate St
- 8586 Holly Way
- 8463 Hickory Dr
- 536 N Colgate St
- 8615 Crescent Ave
- 8567 Holly Way
- 8498 Dale St
- 8592 Holly Way
- 527 N Colgate St
- 8488 Dale St
- 8451 Hickory Dr