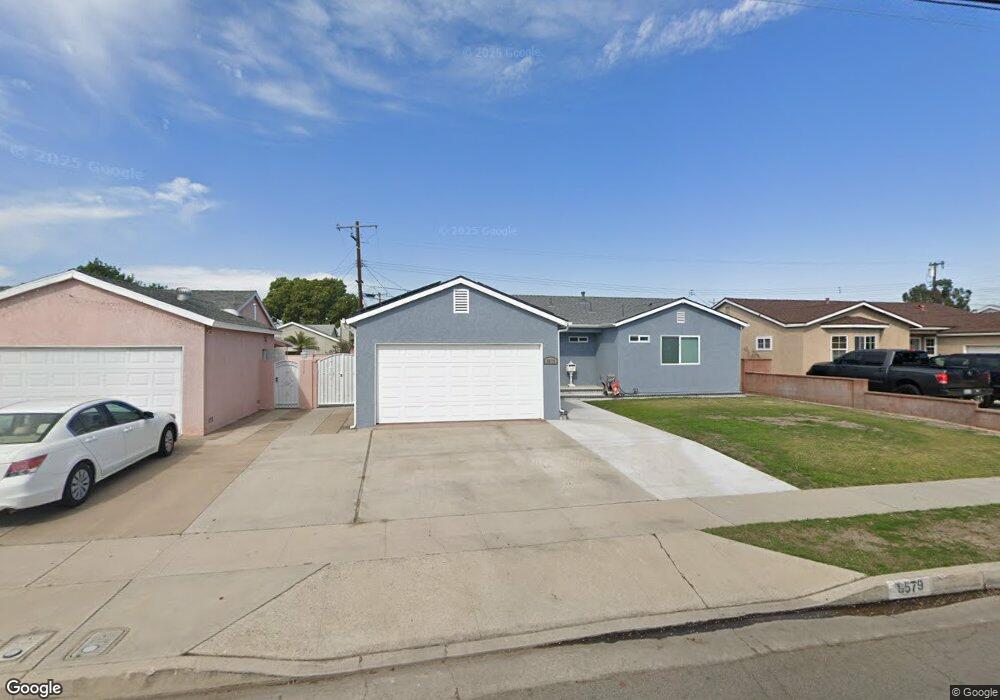
8579 Crescent Ave Buena Park, CA 90620
Estimated Value: $798,000 - $893,879
3
Beds
2
Baths
1,523
Sq Ft
$559/Sq Ft
Est. Value
About This Home
This home is located at 8579 Crescent Ave, Buena Park, CA 90620 and is currently estimated at $851,720, approximately $559 per square foot. 8579 Crescent Ave is a home located in Orange County with nearby schools including Dr. Peter Marshall Elementary School, Brookhurst Junior High School, and Savanna High School.
Ownership History
Date
Name
Owned For
Owner Type
Purchase Details
Closed on
Oct 4, 2020
Sold by
Hucko Family Revocable Trust
Bought by
Hucko Family Revocable Trust
Current Estimated Value
Home Financials for this Owner
Home Financials are based on the most recent Mortgage that was taken out on this home.
Original Mortgage
$250,000
Interest Rate
6.7%
Mortgage Type
Balloon
Purchase Details
Closed on
Apr 14, 1999
Sold by
Federal National Mortgage Association
Bought by
Hucko Gregory W and Hucko Ardell R
Home Financials for this Owner
Home Financials are based on the most recent Mortgage that was taken out on this home.
Original Mortgage
$168,610
Interest Rate
7.1%
Mortgage Type
FHA
Purchase Details
Closed on
Nov 30, 1998
Sold by
Walters Walter C and Walters Angella J
Bought by
Federal National Mortgage Association
Create a Home Valuation Report for This Property
The Home Valuation Report is an in-depth analysis detailing your home's value as well as a comparison with similar homes in the area
Home Values in the Area
Average Home Value in this Area
Purchase History
| Date | Buyer | Sale Price | Title Company |
|---|---|---|---|
| Hucko Family Revocable Trust | -- | -- | |
| Hucko Gregory W | -- | None Available | |
| Hucko Gregory W | $170,000 | Fidelity National Title Ins | |
| Federal National Mortgage Association | $156,738 | Fidelity National Title Ins |
Source: Public Records
Mortgage History
| Date | Status | Borrower | Loan Amount |
|---|---|---|---|
| Previous Owner | Hucko Family Revocable Trust | $250,000 | |
| Previous Owner | Hucko Gregory W | $168,610 |
Source: Public Records
Tax History Compared to Growth
Tax History
| Year | Tax Paid | Tax Assessment Tax Assessment Total Assessment is a certain percentage of the fair market value that is determined by local assessors to be the total taxable value of land and additions on the property. | Land | Improvement |
|---|---|---|---|---|
| 2025 | $3,347 | $278,801 | $189,863 | $88,938 |
| 2024 | $3,347 | $273,335 | $186,140 | $87,195 |
| 2023 | $3,132 | $256,151 | $182,490 | $73,661 |
| 2022 | $3,099 | $251,129 | $178,912 | $72,217 |
| 2021 | $3,062 | $246,205 | $175,404 | $70,801 |
| 2020 | $3,045 | $243,681 | $173,605 | $70,076 |
| 2019 | $2,973 | $238,903 | $170,201 | $68,702 |
| 2018 | $2,937 | $234,219 | $166,864 | $67,355 |
| 2017 | $2,837 | $229,627 | $163,592 | $66,035 |
| 2016 | $2,823 | $225,125 | $160,384 | $64,741 |
| 2015 | $2,795 | $221,744 | $157,975 | $63,769 |
| 2014 | $2,658 | $217,401 | $154,881 | $62,520 |
Source: Public Records
Map
Nearby Homes
- 605 N La Reina St
- 8319 Hickory Dr
- 400 N Syracuse St
- 2625 W Cameron Ct Unit 121
- 2709 W Madison Cir
- 8054 Teakwood Cir
- 199 N Magnolia Ave Unit B
- 2955 W Lincoln Ave Unit 7
- 2544 W Greenacre Ave
- 2871 W Tyler Ave
- 2770 W Lincoln Ave Unit 40
- 2770 W Lincoln Ave Unit 58
- 8452 Stanton Ave
- 8434 Periwinkle Dr
- 2943 W Lincoln Ave
- 1006 N Hampton Place
- 525 N Gilbert St Unit 106
- 525 N Gilbert St Unit 151
- Plan Two at Mason
- Plan Four at Mason
- 8567 Crescent Ave
- 8574 Holly Way
- 8580 Holly Way
- 8568 Holly Way
- 8603 Crescent Ave
- 537 N Colgate St
- 8586 Holly Way
- 536 N Colgate St
- 8615 Crescent Ave
- 8592 Holly Way
- 8499 Hickory Dr
- 8487 Hickory Dr
- 531 N Colgate St
- 8475 Hickory Dr
- 2754 W Crescent Ave
- 8625 Crescent Ave
- 530 N Colgate St
- 8573 Holly Way
- 8598 Holly Way
- 8463 Hickory Dr