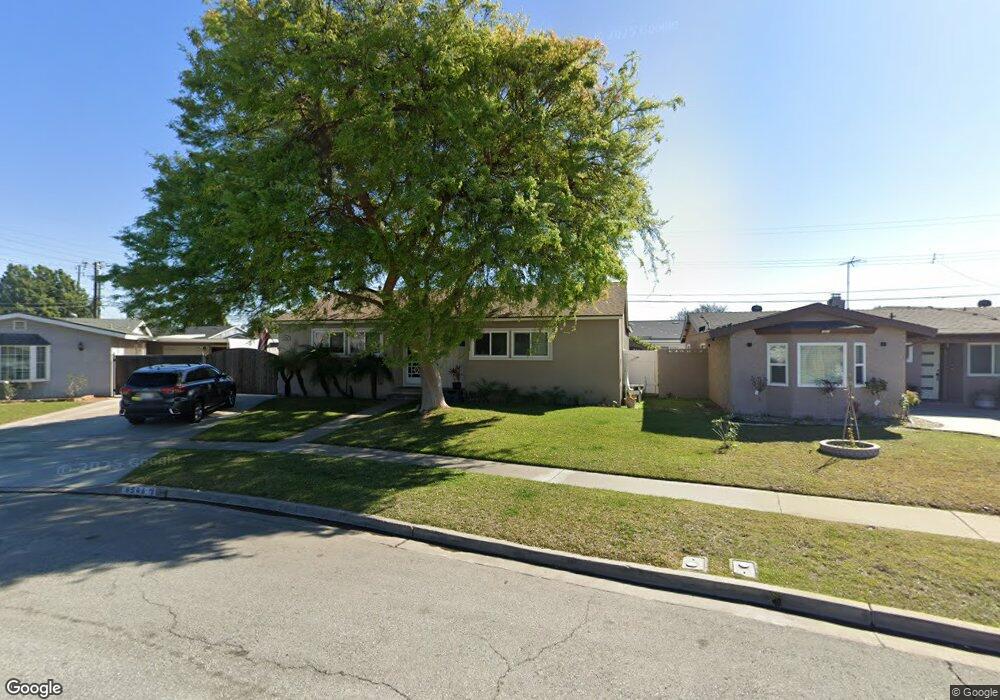
8588 Hemlock Way Buena Park, CA 90620
Estimated Value: $834,000 - $1,028,000
4
Beds
2
Baths
1,795
Sq Ft
$523/Sq Ft
Est. Value
About This Home
This home is located at 8588 Hemlock Way, Buena Park, CA 90620 and is currently estimated at $938,185, approximately $522 per square foot. 8588 Hemlock Way is a home located in Orange County with nearby schools including Glen H. Dysinger Sr. Elementary School, Brookhurst Junior High School, and Savanna High School.
Ownership History
Date
Name
Owned For
Owner Type
Purchase Details
Closed on
Jan 25, 2008
Sold by
Daleiden John H
Bought by
Daleiden John H and Daleiden Kristen D
Current Estimated Value
Home Financials for this Owner
Home Financials are based on the most recent Mortgage that was taken out on this home.
Original Mortgage
$203,650
Outstanding Balance
$129,194
Interest Rate
6.17%
Mortgage Type
New Conventional
Estimated Equity
$808,991
Purchase Details
Closed on
Mar 6, 2002
Sold by
Daleiden Michelle
Bought by
Daleiden John H
Purchase Details
Closed on
Jan 18, 2000
Sold by
Crockwell Richard M and Crockwell Judith A
Bought by
Daleiden John H and Daleiden Michelle
Home Financials for this Owner
Home Financials are based on the most recent Mortgage that was taken out on this home.
Original Mortgage
$202,700
Interest Rate
8.16%
Purchase Details
Closed on
Oct 25, 1999
Sold by
Crockwell Richard M and Crockwell Judith A
Bought by
Crockwell Richard M and Crockwell Judith A
Create a Home Valuation Report for This Property
The Home Valuation Report is an in-depth analysis detailing your home's value as well as a comparison with similar homes in the area
Home Values in the Area
Average Home Value in this Area
Purchase History
| Date | Buyer | Sale Price | Title Company |
|---|---|---|---|
| Daleiden John H | -- | Lenders Choice Title Company | |
| Daleiden John H | -- | Chicago Title Co | |
| Daleiden John H | $209,000 | Commonwealth Land Title | |
| Crockwell Richard M | -- | -- |
Source: Public Records
Mortgage History
| Date | Status | Borrower | Loan Amount |
|---|---|---|---|
| Open | Daleiden John H | $203,650 | |
| Closed | Daleiden John H | $202,700 |
Source: Public Records
Tax History Compared to Growth
Tax History
| Year | Tax Paid | Tax Assessment Tax Assessment Total Assessment is a certain percentage of the fair market value that is determined by local assessors to be the total taxable value of land and additions on the property. | Land | Improvement |
|---|---|---|---|---|
| 2025 | $4,450 | $389,987 | $253,572 | $136,415 |
| 2024 | $4,450 | $382,341 | $248,600 | $133,741 |
| 2023 | $4,333 | $374,845 | $243,726 | $131,119 |
| 2022 | $4,105 | $350,604 | $238,947 | $111,657 |
| 2021 | $3,540 | $296,755 | $234,261 | $62,494 |
| 2020 | $3,519 | $293,713 | $231,859 | $61,854 |
| 2019 | $3,434 | $287,954 | $227,312 | $60,642 |
| 2018 | $3,391 | $282,308 | $222,855 | $59,453 |
| 2017 | $3,272 | $276,773 | $218,485 | $58,288 |
| 2016 | $3,255 | $271,347 | $214,201 | $57,146 |
| 2015 | $3,221 | $267,272 | $210,984 | $56,288 |
| 2014 | $3,061 | $262,037 | $206,851 | $55,186 |
Source: Public Records
Map
Nearby Homes
- 8319 Hickory Dr
- 8054 Teakwood Cir
- 605 N La Reina St
- 8434 Periwinkle Dr
- 2625 W Cameron Ct Unit 121
- 400 N Syracuse St
- 2544 W Greenacre Ave
- 2709 W Madison Cir
- 21 Centerstone Cir
- 1006 N Hampton Place
- 8452 Stanton Ave
- 2955 W Lincoln Ave Unit 7
- 1028 N Mayflower St
- 199 N Magnolia Ave Unit B
- 2871 W Tyler Ave
- 2697 W Parkside Ln
- 525 N Gilbert St Unit 106
- 525 N Gilbert St Unit 151
- 8026 Carnation Dr
- 728 N Geneva St
- 8584 Hemlock Way
- 8592 Hemlock Way
- 8627 Greenleaf Ave
- 8615 Greenleaf Ave
- 8639 Greenleaf Ave
- 8580 Hemlock Way
- 8596 Hemlock Way
- 8603 Greenleaf Ave
- 8651 Greenleaf Ave
- 8599 Hemlock Way
- 8576 Hemlock Way
- 8600 Hemlock Way
- 8229 Guava Ave
- 8217 Guava Ave
- 8591 Greenleaf Ave
- 8591 Hemlock Way
- 8205 Guava Ave
- 8663 Greenleaf Ave
- 8604 Hemlock Way
- 8572 Hemlock Way