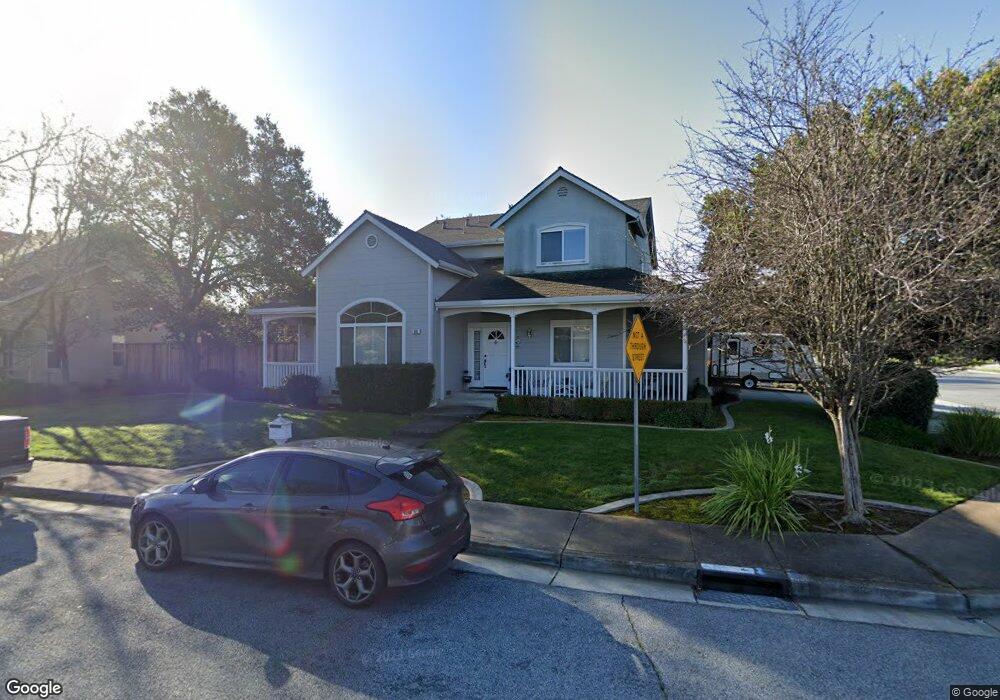
860 Greystone Ct Gilroy, CA 95020
Las Animas NeighborhoodEstimated Value: $1,001,000 - $1,375,000
4
Beds
3
Baths
2,421
Sq Ft
$473/Sq Ft
Est. Value
About This Home
This home is located at 860 Greystone Ct, Gilroy, CA 95020 and is currently estimated at $1,144,441, approximately $472 per square foot. 860 Greystone Ct is a home located in Santa Clara County with nearby schools including Rod Kelley Elementary School, South Valley Middle School, and Solorsano Middle School.
Ownership History
Date
Name
Owned For
Owner Type
Purchase Details
Closed on
Mar 15, 2002
Sold by
Prudential Relocation Inc
Bought by
Mcmahon Edward A and Mcmahon Christine M
Current Estimated Value
Home Financials for this Owner
Home Financials are based on the most recent Mortgage that was taken out on this home.
Original Mortgage
$399,900
Outstanding Balance
$164,579
Interest Rate
6.85%
Estimated Equity
$979,862
Purchase Details
Closed on
Oct 27, 2001
Sold by
Slingland Kenneth and Slingland Debbie A
Bought by
Citicapital Relocation Inc
Purchase Details
Closed on
Oct 7, 1996
Sold by
Slingland Kenneth
Bought by
Slingland Kenneth and Slingland Debbie A
Home Financials for this Owner
Home Financials are based on the most recent Mortgage that was taken out on this home.
Original Mortgage
$279,700
Interest Rate
8.2%
Purchase Details
Closed on
Aug 28, 1996
Sold by
Custom One Inc
Bought by
Slingland Kenneth
Home Financials for this Owner
Home Financials are based on the most recent Mortgage that was taken out on this home.
Original Mortgage
$279,700
Interest Rate
8.2%
Create a Home Valuation Report for This Property
The Home Valuation Report is an in-depth analysis detailing your home's value as well as a comparison with similar homes in the area
Home Values in the Area
Average Home Value in this Area
Purchase History
| Date | Buyer | Sale Price | Title Company |
|---|---|---|---|
| Mcmahon Edward A | $500,000 | Fidelity National Title Ins | |
| Citicapital Relocation Inc | $502,500 | Fidelity National Title Ins | |
| Slingland Kenneth | -- | Old Republic Title Company | |
| Slingland Kenneth | $314,000 | Old Republic Title Company | |
| Slingland Kenneth | -- | Old Republic Title Company |
Source: Public Records
Mortgage History
| Date | Status | Borrower | Loan Amount |
|---|---|---|---|
| Open | Mcmahon Edward A | $399,900 | |
| Previous Owner | Slingland Kenneth | $279,700 | |
| Closed | Mcmahon Edward A | $75,000 |
Source: Public Records
Tax History Compared to Growth
Tax History
| Year | Tax Paid | Tax Assessment Tax Assessment Total Assessment is a certain percentage of the fair market value that is determined by local assessors to be the total taxable value of land and additions on the property. | Land | Improvement |
|---|---|---|---|---|
| 2025 | $8,997 | $738,483 | $369,316 | $369,167 |
| 2024 | $8,997 | $724,004 | $362,075 | $361,929 |
| 2023 | $8,944 | $709,809 | $354,976 | $354,833 |
| 2022 | $8,798 | $695,892 | $348,016 | $347,876 |
| 2021 | $8,760 | $682,248 | $341,193 | $341,055 |
| 2020 | $8,664 | $675,253 | $337,695 | $337,558 |
| 2019 | $8,584 | $662,014 | $331,074 | $330,940 |
| 2018 | $8,015 | $649,034 | $324,583 | $324,451 |
| 2017 | $8,185 | $636,309 | $318,219 | $318,090 |
| 2016 | $8,022 | $623,833 | $311,980 | $311,853 |
| 2015 | $7,568 | $614,463 | $307,294 | $307,169 |
| 2014 | $7,522 | $602,427 | $301,275 | $301,152 |
Source: Public Records
Map
Nearby Homes
- 796 Gary St
- 958 Bosco Ln Unit 1603
- 8190 Westwood Dr
- 8170 Westwood Dr Unit 22
- 780 Welburn Ave
- 722 Carver Place
- 714 Sullivan Way
- 751 La Paloma Way
- 1297 Chesbro Way
- 1206 Sycamore Ct
- 670 Wickham Ct
- 7950 English Oak Cir
- 8420 David Ct
- 8120 Catalina Ct
- 7934 Spanish Oak Cir
- 100 Block Ronan Ave
- 1555 Hecker Pass Rd Unit D201
- 201 Ronan Ave
- 1355 Cypress Ct
- 190 Ronan Ave
- 850 Greystone Ct
- 8540 Kern Ave
- 8530 Kern Ave
- 861 Greystone Ct
- 840 Greystone Ct
- 8555 Kern Ave
- 8565 Kern Ave
- 8545 Kern Ave
- 851 Greystone Ct
- 8570 Kern Ave
- 8575 Kern Ave
- 8535 Kern Ave
- 830 Greystone Ct
- 841 Greystone Ct
- 8546 Magnolia Way
- 8525 Kern Ave
- 870 Birch Place
- 8520 Kern Ave
- 8700 Kern Ave
- 8560 Culp Dr