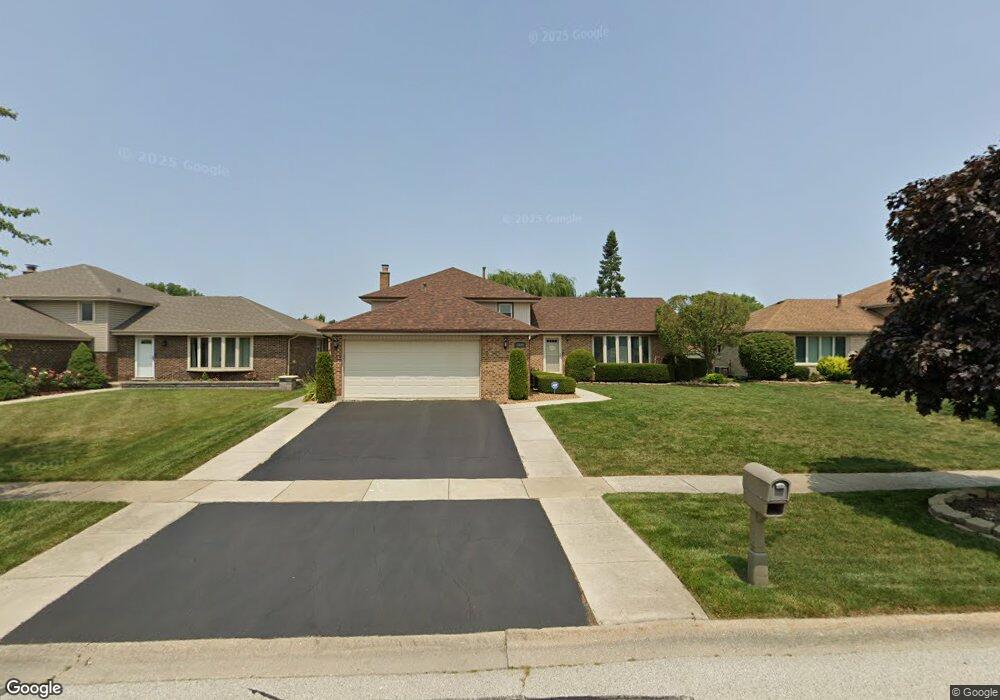
8606 Carriage Ln Tinley Park, IL 60487
Central Tinley Park NeighborhoodEstimated Value: $387,719 - $400,000
3
Beds
2
Baths
1,474
Sq Ft
$268/Sq Ft
Est. Value
About This Home
This home is located at 8606 Carriage Ln, Tinley Park, IL 60487 and is currently estimated at $395,573, approximately $268 per square foot. 8606 Carriage Ln is a home located in Cook County with nearby schools including Christa Mcauliffe School, Prairie View Middle School, and Victor J Andrew High School.
Ownership History
Date
Name
Owned For
Owner Type
Purchase Details
Closed on
Oct 27, 2011
Sold by
Danielwicz Allan J and Settlemires Kristi D
Bought by
Tessari Nick W and Tessari Rebecca J
Current Estimated Value
Home Financials for this Owner
Home Financials are based on the most recent Mortgage that was taken out on this home.
Original Mortgage
$243,662
Interest Rate
4.02%
Mortgage Type
FHA
Purchase Details
Closed on
Feb 27, 2009
Sold by
Potempa John and Potempa Karen
Bought by
Danielwicz Alan J and Settlemires Kristi D
Home Financials for this Owner
Home Financials are based on the most recent Mortgage that was taken out on this home.
Original Mortgage
$237,688
Interest Rate
5.2%
Mortgage Type
FHA
Purchase Details
Closed on
May 26, 2005
Sold by
Kenny Patrick and Kenny Elizabeth
Bought by
Potempa John and Potempa Karen
Home Financials for this Owner
Home Financials are based on the most recent Mortgage that was taken out on this home.
Original Mortgage
$220,000
Interest Rate
5.91%
Mortgage Type
Fannie Mae Freddie Mac
Create a Home Valuation Report for This Property
The Home Valuation Report is an in-depth analysis detailing your home's value as well as a comparison with similar homes in the area
Home Values in the Area
Average Home Value in this Area
Purchase History
| Date | Buyer | Sale Price | Title Company |
|---|---|---|---|
| Tessari Nick W | $250,000 | Rpt | |
| Danielwicz Alan J | $292,000 | Stewart Title Company | |
| Potempa John | $281,000 | Ticor Title |
Source: Public Records
Mortgage History
| Date | Status | Borrower | Loan Amount |
|---|---|---|---|
| Previous Owner | Tessari Nick W | $243,662 | |
| Previous Owner | Danielwicz Alan J | $237,688 | |
| Previous Owner | Potempa John | $220,000 |
Source: Public Records
Tax History Compared to Growth
Tax History
| Year | Tax Paid | Tax Assessment Tax Assessment Total Assessment is a certain percentage of the fair market value that is determined by local assessors to be the total taxable value of land and additions on the property. | Land | Improvement |
|---|---|---|---|---|
| 2024 | $8,797 | $35,000 | $4,816 | $30,184 |
| 2023 | $6,628 | $35,000 | $4,816 | $30,184 |
| 2022 | $6,628 | $22,013 | $4,188 | $17,825 |
| 2021 | $6,446 | $22,011 | $4,187 | $17,824 |
| 2020 | $6,355 | $22,011 | $4,187 | $17,824 |
| 2019 | $6,649 | $23,930 | $3,768 | $20,162 |
| 2018 | $6,505 | $23,930 | $3,768 | $20,162 |
| 2017 | $6,350 | $23,930 | $3,768 | $20,162 |
| 2016 | $5,766 | $19,859 | $3,350 | $16,509 |
| 2015 | $5,663 | $19,859 | $3,350 | $16,509 |
| 2014 | $6,093 | $21,274 | $3,350 | $17,924 |
| 2013 | $6,116 | $22,879 | $3,350 | $19,529 |
Source: Public Records
Map
Nearby Homes
- 8543 Carriage Ln
- 8548 Bethany Ln
- 17324 Humber Ln
- 17155 Kamp Ct Unit 9
- 8456 170th Place
- 8444 W 171st St
- Fremont Plan at Radcliffe Place
- Calysta Plan at Radcliffe Place
- Danbury Plan at Radcliffe Place
- Briarcliffe Plan at Radcliffe Place
- Eden Plan at Radcliffe Place
- Amberwood Plan at Radcliffe Place
- 8721 W 169th St
- 8229 170th St Unit 8229
- 17230 Shetland Dr
- 8313 Aster Ln
- 8750 W 169th St
- 17631 Dover Ct
- 16933 Richards Dr
- 8710 W 168th St
- 8612 Carriage Ln
- 8600 Carriage Ln
- 8607 Bethany Ln
- 8618 Carriage Ln
- 8613 Bethany Ln
- 17226 Valley Dr
- 17238 Valley Dr
- 8619 Bethany Ln
- 8601 Bethany Ln
- 8624 Carriage Ln
- 8625 Bethany Ln
- 8630 Carriage Ln
- 8555 Carriage Ln
- 8631 Bethany Ln
- 17208 Valley Dr
- 17244 Valley Dr
- 8636 Carriage Ln
- 8618 Bethany Ln
- 17231 Valley Dr
- 17225 Valley Dr