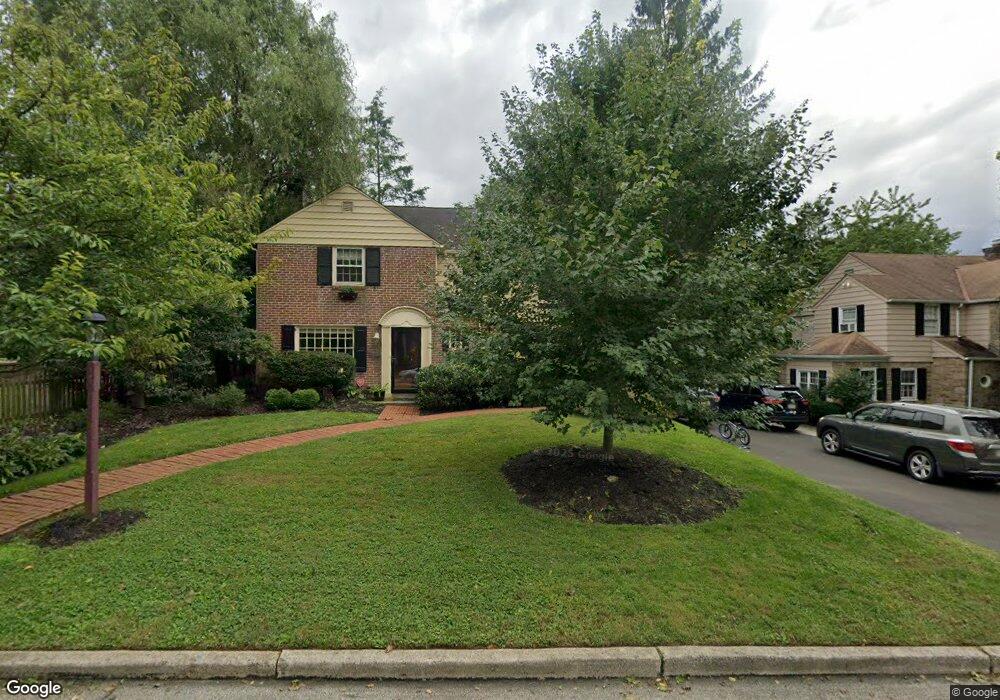
861 Valley View Rd Flourtown, PA 19031
Estimated Value: $470,000 - $657,000
3
Beds
1
Bath
2,019
Sq Ft
$267/Sq Ft
Est. Value
About This Home
This home is located at 861 Valley View Rd, Flourtown, PA 19031 and is currently estimated at $538,670, approximately $266 per square foot. 861 Valley View Rd is a home located in Montgomery County with nearby schools including Whitemarsh El School, Colonial Elementary School, and Colonial Middle School.
Ownership History
Date
Name
Owned For
Owner Type
Purchase Details
Closed on
Sep 22, 2010
Sold by
Buckley Catherine D and Macklem Gordon F
Bought by
Egginton Peter G and Egginton Mary Mchale
Current Estimated Value
Home Financials for this Owner
Home Financials are based on the most recent Mortgage that was taken out on this home.
Original Mortgage
$334,800
Outstanding Balance
$220,292
Interest Rate
4.37%
Estimated Equity
$318,378
Purchase Details
Closed on
Mar 31, 2006
Sold by
Reilly Thomas W
Bought by
Macklem Gordon F and Buckley Catherine D
Home Financials for this Owner
Home Financials are based on the most recent Mortgage that was taken out on this home.
Original Mortgage
$200,000
Interest Rate
6.28%
Purchase Details
Closed on
Apr 28, 2000
Sold by
Sullivan Michael and Sullivan Megan
Bought by
Reilly Thomas W
Purchase Details
Closed on
Aug 31, 1995
Sold by
Breen Richard F and Breen Ann M
Bought by
Sullivan Michael and Sullivan Megan
Create a Home Valuation Report for This Property
The Home Valuation Report is an in-depth analysis detailing your home's value as well as a comparison with similar homes in the area
Home Values in the Area
Average Home Value in this Area
Purchase History
| Date | Buyer | Sale Price | Title Company |
|---|---|---|---|
| Egginton Peter G | $372,000 | None Available | |
| Macklem Gordon F | $409,000 | None Available | |
| Reilly Thomas W | $197,230 | -- | |
| Sullivan Michael | $172,500 | -- |
Source: Public Records
Mortgage History
| Date | Status | Borrower | Loan Amount |
|---|---|---|---|
| Open | Egginton Peter G | $334,800 | |
| Previous Owner | Macklem Gordon F | $200,000 |
Source: Public Records
Tax History Compared to Growth
Tax History
| Year | Tax Paid | Tax Assessment Tax Assessment Total Assessment is a certain percentage of the fair market value that is determined by local assessors to be the total taxable value of land and additions on the property. | Land | Improvement |
|---|---|---|---|---|
| 2025 | $4,048 | $124,330 | $51,290 | $73,040 |
| 2024 | $4,048 | $124,330 | $51,290 | $73,040 |
| 2023 | $3,902 | $124,330 | $51,290 | $73,040 |
| 2022 | $3,813 | $124,330 | $51,290 | $73,040 |
| 2021 | $3,699 | $124,330 | $51,290 | $73,040 |
| 2020 | $3,563 | $124,330 | $51,290 | $73,040 |
| 2019 | $3,457 | $124,330 | $51,290 | $73,040 |
| 2018 | $970 | $124,330 | $51,290 | $73,040 |
| 2017 | $3,338 | $124,330 | $51,290 | $73,040 |
| 2016 | $3,289 | $124,330 | $51,290 | $73,040 |
| 2015 | $3,145 | $124,330 | $51,290 | $73,040 |
| 2014 | $3,145 | $124,330 | $51,290 | $73,040 |
Source: Public Records
Map
Nearby Homes
- 28 Grove Ave
- 9 Comly Ct
- 21 Jones Ave
- 21 Franklin Ave
- 32 Jones Ave
- 6313 Sunnybrook Rd
- 2106 Carolton Way
- 6150 Creekside Dr
- 5 Erdenheim Rd
- 204 Pelham Ct
- 1005 Harston Ln
- 402 Longfield Rd
- 106 Montgomery Ave
- 401 Pennybrook Ct Unit 1 REDFORD END
- 001 Pennybrook Ct Unit REDFORD INTERIOR
- 405 Pennybrook Ct Unit 3 REDFORD INTERIOR
- 403 Pennybrook Ct Unit 2 REDFORD INTERIOR
- 407 Pennybrook Ct Unit 4 REDFORD END
- 404 Pennybrook Ct Unit 15 REDFORD INTERIOR
- 406 Pennybrook Ct Unit 14 REDFORD INTERIOR
- 859 Valley View Rd
- 6195 W Mill Rd
- 6193 W Mill Rd
- 857 Valley View Rd
- 860 Grove Ave
- 858 Grove Ave
- 6191 W Mill Rd
- 860 Valley View Rd
- 858 Valley View Rd
- 855 Valley View Rd
- 856 Grove Ave
- 856 Valley View Rd
- 62 W Mill Rd
- 853 Valley View Rd
- 854 Grove Ave
- 71 Grove Ave
- 6189 W Mill Rd
- 73 Grove Ave
- 69 Grove Ave
- 852 Valley View Rd