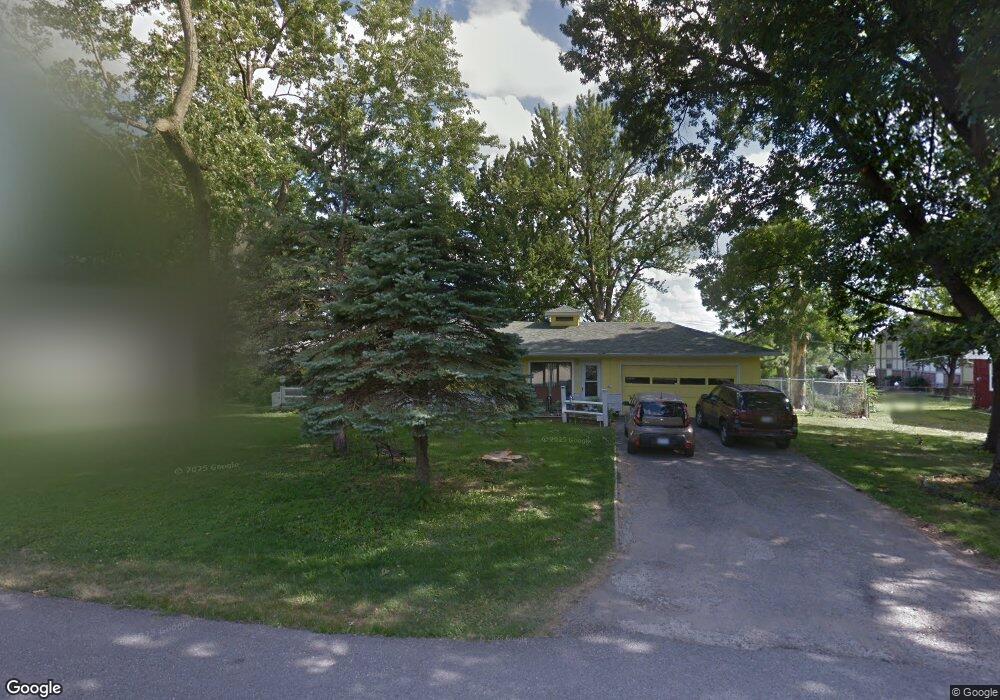
8619 E 74th Terrace Kansas City, MO 64133
Park Farms NeighborhoodEstimated Value: $209,000 - $268,000
3
Beds
2
Baths
1,380
Sq Ft
$169/Sq Ft
Est. Value
About This Home
This home is located at 8619 E 74th Terrace, Kansas City, MO 64133 and is currently estimated at $233,029, approximately $168 per square foot. 8619 E 74th Terrace is a home located in Jackson County with nearby schools including Westridge Elementary School, South Middle School, and Carver Christian Academy.
Ownership History
Date
Name
Owned For
Owner Type
Purchase Details
Closed on
Oct 17, 2001
Sold by
Westbrook Paul V and Westbrook Martha J
Bought by
Massey Marilyn R and Massey Lisa D
Current Estimated Value
Home Financials for this Owner
Home Financials are based on the most recent Mortgage that was taken out on this home.
Original Mortgage
$122,797
Outstanding Balance
$47,927
Interest Rate
6.85%
Mortgage Type
FHA
Estimated Equity
$185,102
Purchase Details
Closed on
Jul 14, 1998
Sold by
Holmes Saundra F
Bought by
Westbrook Paul V and Westbrook Martha J
Home Financials for this Owner
Home Financials are based on the most recent Mortgage that was taken out on this home.
Original Mortgage
$74,855
Interest Rate
7.09%
Mortgage Type
VA
Purchase Details
Closed on
Nov 22, 1995
Sold by
Williams Elizabeth A and Baggerly Elizabeth A
Bought by
Holmes Saundra F
Home Financials for this Owner
Home Financials are based on the most recent Mortgage that was taken out on this home.
Original Mortgage
$68,450
Interest Rate
7.36%
Mortgage Type
FHA
Create a Home Valuation Report for This Property
The Home Valuation Report is an in-depth analysis detailing your home's value as well as a comparison with similar homes in the area
Home Values in the Area
Average Home Value in this Area
Purchase History
| Date | Buyer | Sale Price | Title Company |
|---|---|---|---|
| Massey Marilyn R | -- | Security Land Title Company | |
| Westbrook Paul V | -- | -- | |
| Holmes Saundra F | -- | Security Land Title Company |
Source: Public Records
Mortgage History
| Date | Status | Borrower | Loan Amount |
|---|---|---|---|
| Open | Massey Marilyn R | $122,797 | |
| Previous Owner | Westbrook Paul V | $74,855 | |
| Previous Owner | Holmes Saundra F | $68,450 |
Source: Public Records
Tax History Compared to Growth
Tax History
| Year | Tax Paid | Tax Assessment Tax Assessment Total Assessment is a certain percentage of the fair market value that is determined by local assessors to be the total taxable value of land and additions on the property. | Land | Improvement |
|---|---|---|---|---|
| 2025 | $2,495 | $27,891 | $4,606 | $23,285 |
| 2024 | $2,479 | $27,565 | $5,022 | $22,543 |
| 2023 | $2,479 | $27,566 | $3,692 | $23,874 |
| 2022 | $1,973 | $21,090 | $3,069 | $18,021 |
| 2021 | $1,973 | $21,090 | $3,069 | $18,021 |
| 2020 | $1,988 | $21,000 | $3,069 | $17,931 |
| 2019 | $1,950 | $21,000 | $3,069 | $17,931 |
| 2018 | $1,793 | $19,390 | $4,915 | $14,475 |
| 2017 | $1,737 | $19,390 | $4,915 | $14,475 |
| 2016 | $1,737 | $18,905 | $3,523 | $15,382 |
| 2014 | $1,692 | $18,354 | $3,420 | $14,934 |
Source: Public Records
Map
Nearby Homes
- 8716 E 74th St
- 8620 Countryshire Ln
- 8805 E 75th St
- 7628 Booth Ave
- 7632 Booth Ave
- 8812 E 72nd Terrace
- 9111 Vaughn Ave
- 9010 E 75th St
- 7705 Wallace Ave
- 8016 E 75th St
- 7012 Kentucky Ave
- 7036 Hunter St
- 7835 Donnelly Ave
- 7626 Sycamore Ave
- 7612 Sycamore Ave
- 7306 Elm Ave
- 8416 E 79th St
- 6924 Hunter St
- 7138 Sycamore Ave
- 7867 James A Reed Rd
- 8617 E 74th Terrace
- 8701 E 74th Terrace
- 8700 E 74th Terrace
- 8611 E 74th Terrace
- 8616 E 74th Terrace
- 8702 E 74th Terrace
- 8705 E 74th Terrace
- 8612 E 74th Terrace
- 8704 E 74th Terrace
- 8701 E 74th St
- 8619 E 74th St
- 8705 E 74th St
- 8609 E 74th Terrace
- 8707 E 74th Terrace
- 8615 E 74th St
- 8708 E 74th Terrace
- 8608 E 74th Terrace
- 8709 E 74th St
- 8611 E 74th St
- 8713 E 74th St