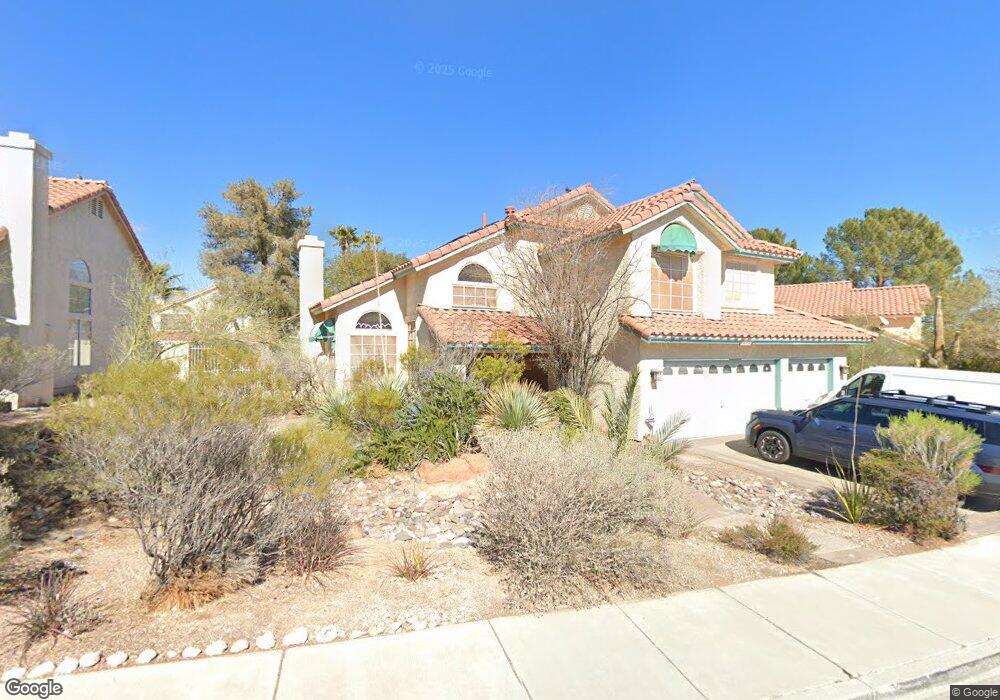
8632 Inwood Dr Las Vegas, NV 89145
Angel Park NeighborhoodEstimated Value: $627,253 - $754,000
5
Beds
3
Baths
2,808
Sq Ft
$250/Sq Ft
Est. Value
About This Home
This home is located at 8632 Inwood Dr, Las Vegas, NV 89145 and is currently estimated at $701,813, approximately $249 per square foot. 8632 Inwood Dr is a home located in Clark County with nearby schools including Walter Jacobson Elementary School, Walter Johnson Junior High School Academy of International Studies, and Palo Verde High School.
Ownership History
Date
Name
Owned For
Owner Type
Purchase Details
Closed on
Sep 22, 2014
Sold by
Ophir Meria
Bought by
Ocm Trust
Current Estimated Value
Purchase Details
Closed on
Jun 24, 2011
Sold by
Ophir Chaim
Bought by
Ophir Meira
Purchase Details
Closed on
Feb 22, 2011
Sold by
Prudential Relocation Inc
Bought by
Ophir Meira
Purchase Details
Closed on
Feb 10, 2011
Sold by
Sweeney Robin L and Shafer David S
Bought by
Prudential Relocation Inc
Purchase Details
Closed on
Oct 26, 1998
Sold by
Davidson Michael D and Davidson Jan Lewellyn
Bought by
Shafer David S and Sweeney Robin L
Home Financials for this Owner
Home Financials are based on the most recent Mortgage that was taken out on this home.
Original Mortgage
$157,500
Interest Rate
6.61%
Create a Home Valuation Report for This Property
The Home Valuation Report is an in-depth analysis detailing your home's value as well as a comparison with similar homes in the area
Home Values in the Area
Average Home Value in this Area
Purchase History
| Date | Buyer | Sale Price | Title Company |
|---|---|---|---|
| Ocm Trust | -- | None Available | |
| Ophir Meira | -- | Fidelity National Title Las | |
| Ophir Meira | $210,000 | Fidelity National Title Las | |
| Prudential Relocation Inc | $210,000 | Fidelity National Title Las | |
| Shafer David S | $210,000 | Old Republic Title Company |
Source: Public Records
Mortgage History
| Date | Status | Borrower | Loan Amount |
|---|---|---|---|
| Previous Owner | Shafer David S | $157,500 | |
| Closed | Shafer David S | $31,500 |
Source: Public Records
Tax History Compared to Growth
Tax History
| Year | Tax Paid | Tax Assessment Tax Assessment Total Assessment is a certain percentage of the fair market value that is determined by local assessors to be the total taxable value of land and additions on the property. | Land | Improvement |
|---|---|---|---|---|
| 2025 | $3,746 | $129,214 | $47,250 | $81,964 |
| 2024 | $3,469 | $129,214 | $47,250 | $81,964 |
| 2023 | $3,469 | $126,141 | $47,600 | $78,541 |
| 2022 | $3,212 | $112,494 | $39,900 | $72,594 |
| 2021 | $2,974 | $104,273 | $35,000 | $69,273 |
| 2020 | $2,759 | $102,364 | $33,250 | $69,114 |
| 2019 | $2,586 | $98,788 | $30,100 | $68,688 |
| 2018 | $2,467 | $91,145 | $24,850 | $66,295 |
| 2017 | $3,035 | $92,580 | $24,850 | $67,730 |
| 2016 | $2,310 | $87,718 | $19,600 | $68,118 |
| 2015 | $2,305 | $82,387 | $18,200 | $64,187 |
| 2014 | $2,233 | $74,518 | $12,250 | $62,268 |
Source: Public Records
Map
Nearby Homes
- 8600 W Charleston Blvd Unit 2058
- 8600 W Charleston Blvd Unit 2018
- 8600 W Charleston Blvd Unit 1079
- 8600 W Charleston Blvd Unit 1198
- 8600 W Charleston Blvd Unit 2101
- 805 Overview Dr
- 817 Hillgrove Ct
- 8628 Highacre Dr
- 609 Ampere Ln
- 8640 Blissville Ave
- 1209 Emerywood Ct
- 8612 Blissville Ave
- 8452 Boseck Dr Unit 208
- 8452 Boseck Dr Unit 159
- 8452 Boseck Dr Unit 287
- 1513 Brocado Ln
- 8400 W Charleston Blvd Unit 111
- 8400 W Charleston Blvd Unit 237
- 8400 White Eagle Ave Unit 203
- 8425 Running Deer Ave Unit 104
- 8628 Inwood Dr
- 8636 Inwood Dr
- 812 Hillgrove Ct
- 8624 Inwood Dr
- 8640 Inwood Dr
- 8641 Inwood Dr
- 8637 Inwood Dr
- 8645 Inwood Dr
- 816 Hillgrove Ct
- 804 Hillgrove Ct
- 8649 Inwood Dr
- 8620 Inwood Dr
- 8644 Inwood Dr
- 8625 Inwood Dr
- 820 Hillgrove Ct
- 8633 Inwood Dr
- 8653 Inwood Dr
- 805 Hillgrove Ct
- 800 Hillgrove Ct
- 8629 Inwood Dr