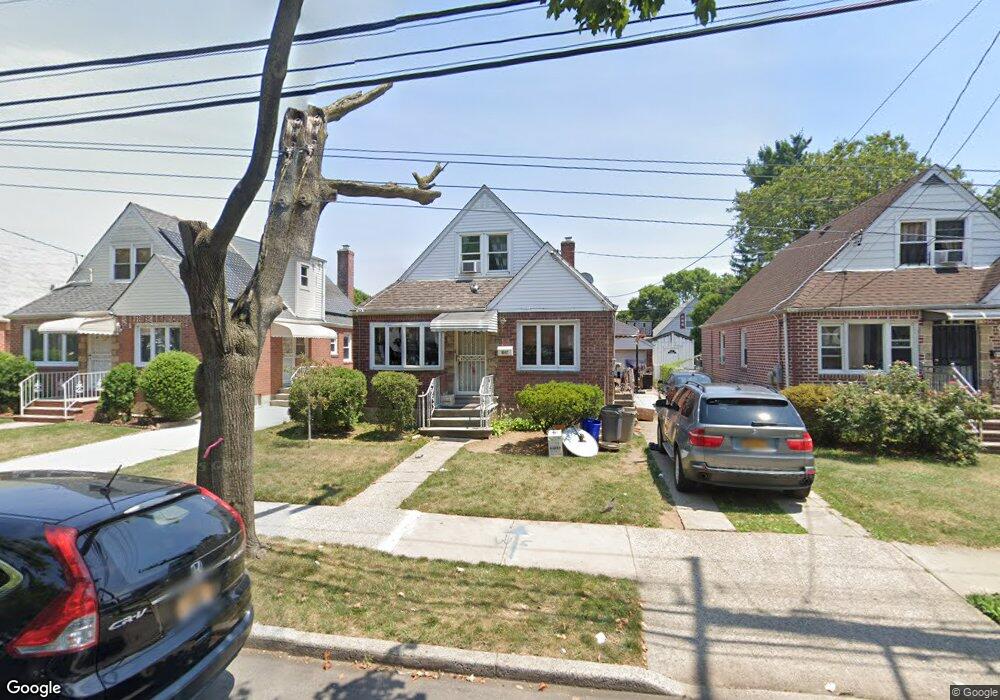
8647 Winchester Blvd Queens Village, NY 11427
Bellerose NeighborhoodEstimated Value: $753,145 - $888,000
--
Bed
--
Bath
1,240
Sq Ft
$681/Sq Ft
Est. Value
About This Home
This home is located at 8647 Winchester Blvd, Queens Village, NY 11427 and is currently estimated at $844,536, approximately $681 per square foot. 8647 Winchester Blvd is a home located in Queens County with nearby schools including P.S. 18 Q The Winchester School, Irwin Altman Middle School 172, and Martin Van Buren High School.
Ownership History
Date
Name
Owned For
Owner Type
Purchase Details
Closed on
Aug 28, 2002
Sold by
Silvestre Rommel and Silvestre Gemmelee
Bought by
Timan Salvacion
Current Estimated Value
Home Financials for this Owner
Home Financials are based on the most recent Mortgage that was taken out on this home.
Original Mortgage
$315,000
Outstanding Balance
$131,586
Interest Rate
6.24%
Estimated Equity
$712,950
Purchase Details
Closed on
Nov 15, 2000
Sold by
Rampolla Carlos and Rampolla Raquel Colon
Bought by
Silvestre Rommel and Silvestre Gemmelee
Home Financials for this Owner
Home Financials are based on the most recent Mortgage that was taken out on this home.
Original Mortgage
$222,000
Interest Rate
7.76%
Purchase Details
Closed on
Sep 4, 1996
Sold by
Schmid John George
Bought by
Rampolla Carlos and Rampolla Raquel Colon
Home Financials for this Owner
Home Financials are based on the most recent Mortgage that was taken out on this home.
Original Mortgage
$105,000
Interest Rate
8.1%
Create a Home Valuation Report for This Property
The Home Valuation Report is an in-depth analysis detailing your home's value as well as a comparison with similar homes in the area
Home Values in the Area
Average Home Value in this Area
Purchase History
| Date | Buyer | Sale Price | Title Company |
|---|---|---|---|
| Timan Salvacion | -- | -- | |
| Silvestre Rommel | $277,500 | Chicago Title Insurance Co | |
| Rampolla Carlos | $175,000 | American Title Ins Co |
Source: Public Records
Mortgage History
| Date | Status | Borrower | Loan Amount |
|---|---|---|---|
| Open | Timan Salvacion | $315,000 | |
| Previous Owner | Silvestre Rommel | $222,000 | |
| Previous Owner | Rampolla Carlos | $105,000 |
Source: Public Records
Tax History Compared to Growth
Tax History
| Year | Tax Paid | Tax Assessment Tax Assessment Total Assessment is a certain percentage of the fair market value that is determined by local assessors to be the total taxable value of land and additions on the property. | Land | Improvement |
|---|---|---|---|---|
| 2025 | $7,096 | $35,597 | $11,258 | $24,339 |
| 2024 | $4,254 | $35,329 | $11,377 | $23,952 |
| 2023 | $6,694 | $33,330 | $11,080 | $22,250 |
| 2022 | $6,277 | $42,540 | $14,820 | $27,720 |
| 2021 | $6,243 | $40,680 | $14,820 | $25,860 |
| 2020 | $6,279 | $38,220 | $14,820 | $23,400 |
| 2019 | $6,159 | $39,960 | $14,820 | $25,140 |
| 2018 | $5,662 | $27,775 | $11,358 | $16,417 |
| 2017 | $5,341 | $26,203 | $14,414 | $11,789 |
| 2016 | $4,942 | $26,203 | $14,414 | $11,789 |
| 2015 | $3,586 | $27,780 | $16,500 | $11,280 |
| 2014 | $3,586 | $27,508 | $15,727 | $11,781 |
Source: Public Records
Map
Nearby Homes
- 233-16 87th Ave
- 86-21 233rd St
- 231-22 87th Ave
- 82-159 Country Pointe Cir
- 88-29 Winchester Blvd
- 23026 87th Ave
- 23009 87th Ave
- 229-15 87th Ave Unit 454
- 229-17 87th Ave Unit LOWER
- 229-17 87th Ave
- 86-06 231st St
- 86-06 231st St Unit Upper
- 229-20 Hillside Ave Unit 50-11
- 222-89 Braddock Ave Unit 4B
- 222-89 Braddock Ave Unit 2-E
- 222-89 Braddock Ave Unit 5A
- 222-89 Braddock Ave Unit 6-D
- 22289 Braddock Ave Unit 1G
- 82-39 232nd St
- 8922 Moline St
- 8651 Winchester Blvd
- 8651 Winchester Blvd
- 8651 Winchester Blvd
- 8643 Winchester Blvd
- 8655 Winchester Blvd
- 8639 Winchester Blvd
- 8639 Winchester Blvd
- 8639 Winchester Blvd
- 8648 Musket St
- 86-55 Winchester Blvd
- 8652 Musket St
- 8644 Musket St
- 8659 Winchester Blvd
- 8656 Musket St
- 8640 Musket St
- 8656 Musket St
- 86-33 Winchester Blvd
- 86-56 Musket St
- 8633 Winchester Blvd
- 8636 Musket St