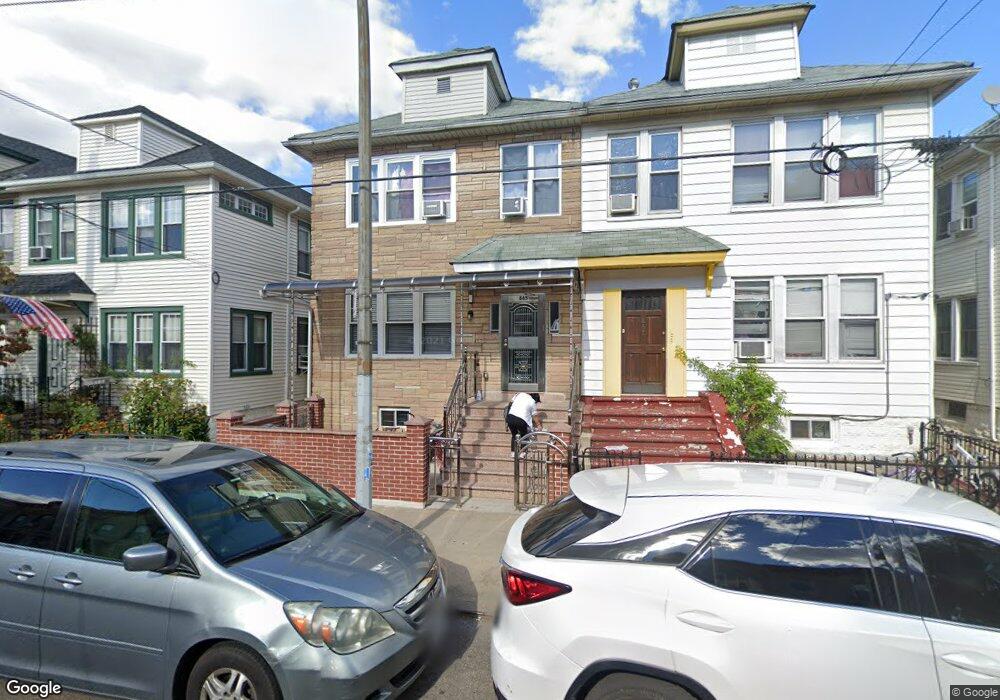
865 71st St Brooklyn, NY 11228
Dyker Heights NeighborhoodEstimated Value: $1,515,791 - $1,754,000
--
Bed
--
Bath
2,480
Sq Ft
$675/Sq Ft
Est. Value
About This Home
This home is located at 865 71st St, Brooklyn, NY 11228 and is currently estimated at $1,673,448, approximately $674 per square foot. 865 71st St is a home located in Kings County with nearby schools including Junior High School 259 William McKinley, Fort Hamilton High School, and St Ephrem School.
Ownership History
Date
Name
Owned For
Owner Type
Purchase Details
Closed on
Oct 10, 2017
Sold by
Lynch Edward M
Bought by
Chen Mei Ying and Gao Yi Chai
Current Estimated Value
Home Financials for this Owner
Home Financials are based on the most recent Mortgage that was taken out on this home.
Original Mortgage
$660,000
Outstanding Balance
$551,286
Interest Rate
3.82%
Mortgage Type
Purchase Money Mortgage
Estimated Equity
$1,122,162
Purchase Details
Closed on
Apr 30, 2002
Sold by
Amalfitano Anthony J and Amalfitano Theresa
Bought by
Lynch Edward M
Home Financials for this Owner
Home Financials are based on the most recent Mortgage that was taken out on this home.
Original Mortgage
$382,500
Interest Rate
6.92%
Mortgage Type
Purchase Money Mortgage
Purchase Details
Closed on
Oct 18, 2001
Sold by
Amalfitano Joseph and Togneri Libbi
Bought by
Amalfitano Anthony J and Amalfitano Theresa
Purchase Details
Closed on
Jun 15, 2000
Sold by
Amalfitano Anthony J and Amalfitano Theresa
Bought by
Amalfitano Joseph and Togneri Libbi
Create a Home Valuation Report for This Property
The Home Valuation Report is an in-depth analysis detailing your home's value as well as a comparison with similar homes in the area
Home Values in the Area
Average Home Value in this Area
Purchase History
| Date | Buyer | Sale Price | Title Company |
|---|---|---|---|
| Chen Mei Ying | $1,360,000 | -- | |
| Chen Mei Ying | $1,360,000 | -- | |
| Lynch Edward M | -- | -- | |
| Lynch Edward M | -- | -- | |
| Amalfitano Anthony J | -- | -- | |
| Amalfitano Anthony J | -- | -- | |
| Amalfitano Joseph | -- | Commonwealth Land Title Ins | |
| Amalfitano Joseph | -- | Commonwealth Land Title Ins |
Source: Public Records
Mortgage History
| Date | Status | Borrower | Loan Amount |
|---|---|---|---|
| Open | Chen Mei Ying | $660,000 | |
| Closed | Chen Mei Ying | $660,000 | |
| Previous Owner | Lynch Edward M | $382,500 |
Source: Public Records
Tax History Compared to Growth
Tax History
| Year | Tax Paid | Tax Assessment Tax Assessment Total Assessment is a certain percentage of the fair market value that is determined by local assessors to be the total taxable value of land and additions on the property. | Land | Improvement |
|---|---|---|---|---|
| 2025 | $12,895 | $112,380 | $22,680 | $89,700 |
| 2024 | $12,895 | $107,700 | $22,680 | $85,020 |
| 2023 | $12,165 | $115,800 | $22,680 | $93,120 |
| 2022 | $11,027 | $100,200 | $22,680 | $77,520 |
| 2021 | $12,244 | $101,100 | $22,680 | $78,420 |
| 2020 | $9,183 | $93,780 | $22,680 | $71,100 |
| 2019 | $11,465 | $89,280 | $22,680 | $66,600 |
| 2018 | $8,386 | $41,138 | $12,581 | $28,557 |
| 2017 | $8,014 | $39,314 | $12,583 | $26,731 |
| 2016 | $7,826 | $39,148 | $12,615 | $26,533 |
| 2015 | $4,253 | $38,517 | $15,247 | $23,270 |
| 2014 | $4,253 | $36,338 | $17,265 | $19,073 |
Source: Public Records
Map
Nearby Homes
- 852 71st St
- 7109 8th Ave
- 849 73rd St
- 877 Bay Ridge Ave Unit 3H
- 847 Bay Ridge Ave
- 845 Bay Ridge Ave
- 850 68th St
- 946 Bay Ridge Ave
- 843 68th St
- 949 72nd St
- 954 Bay Ridge Pkwy
- 6801 Fort Hamilton Pkwy
- 746 68th St
- 719 Bay Ridge Ave
- 760 67th St Unit 3F
- 1001 Bay Ridge Ave
- 639 74th St
- 914 Bay Ridge Pkwy
- 653 Bay Ridge Pkwy
- 1042 70th St