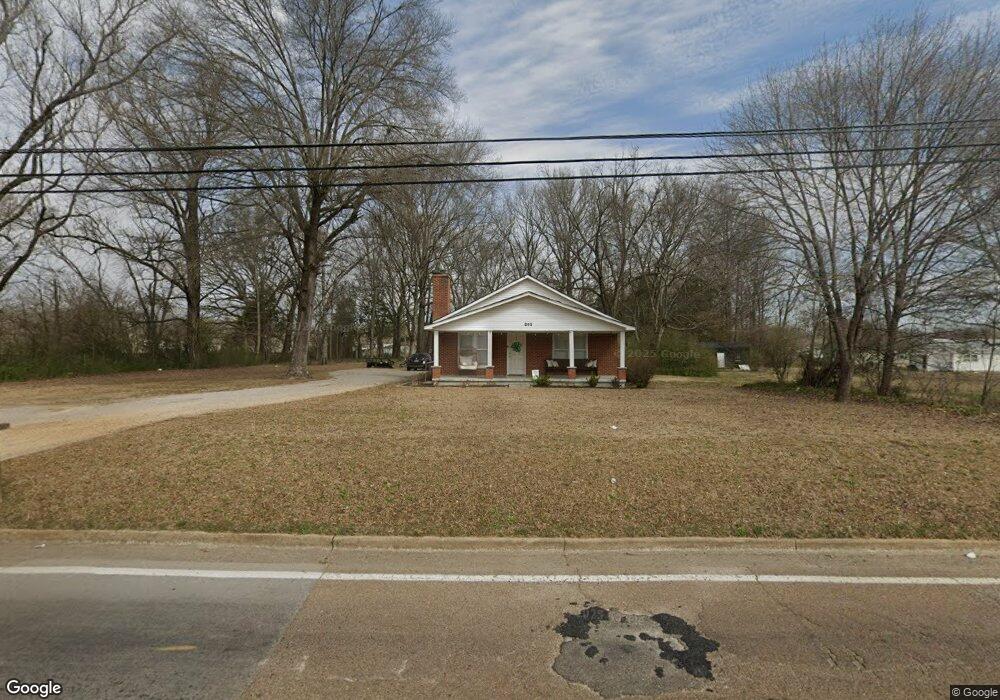
865 Pinhook Dr Savannah, TN 38372
Estimated Value: $84,000 - $122,993
--
Bed
1
Bath
1,107
Sq Ft
$95/Sq Ft
Est. Value
About This Home
This home is located at 865 Pinhook Dr, Savannah, TN 38372 and is currently estimated at $104,748, approximately $94 per square foot. 865 Pinhook Dr is a home located in Hardin County with nearby schools including Hardin County High School and Hardin County Christian School.
Ownership History
Date
Name
Owned For
Owner Type
Purchase Details
Closed on
Jun 29, 2007
Sold by
Wells Fargo Bank N A
Bought by
Boyce Gillis
Current Estimated Value
Purchase Details
Closed on
Nov 7, 2006
Sold by
Gray Christopher Trustee
Bought by
Wells Fargo Bank
Purchase Details
Closed on
Sep 23, 2004
Bought by
Irwin Jackie
Purchase Details
Closed on
Jul 16, 1990
Purchase Details
Closed on
Oct 8, 1982
Purchase Details
Closed on
Feb 17, 1936
Bought by
Mabry Hundley
Purchase Details
Closed on
Mar 28, 1927
Create a Home Valuation Report for This Property
The Home Valuation Report is an in-depth analysis detailing your home's value as well as a comparison with similar homes in the area
Home Values in the Area
Average Home Value in this Area
Purchase History
| Date | Buyer | Sale Price | Title Company |
|---|---|---|---|
| Boyce Gillis | $38,500 | -- | |
| Wells Fargo Bank | $43,200 | -- | |
| Irwin Jackie | $48,000 | -- | |
| -- | -- | -- | |
| -- | -- | -- | |
| Mabry Hundley | -- | -- | |
| -- | -- | -- |
Source: Public Records
Tax History Compared to Growth
Tax History
| Year | Tax Paid | Tax Assessment Tax Assessment Total Assessment is a certain percentage of the fair market value that is determined by local assessors to be the total taxable value of land and additions on the property. | Land | Improvement |
|---|---|---|---|---|
| 2024 | $571 | $23,325 | $4,650 | $18,675 |
| 2023 | $571 | $23,325 | $4,650 | $18,675 |
| 2022 | $460 | $16,650 | $4,650 | $12,000 |
| 2021 | $460 | $16,650 | $4,650 | $12,000 |
| 2020 | $460 | $16,650 | $4,650 | $12,000 |
| 2019 | $460 | $16,650 | $4,650 | $12,000 |
| 2018 | $449 | $16,650 | $4,650 | $12,000 |
| 2017 | $378 | $13,600 | $4,050 | $9,550 |
| 2016 | $378 | $13,600 | $4,050 | $9,550 |
| 2015 | $343 | $13,600 | $4,050 | $9,550 |
| 2014 | $321 | $12,750 | $4,050 | $8,700 |
Source: Public Records
Map
Nearby Homes