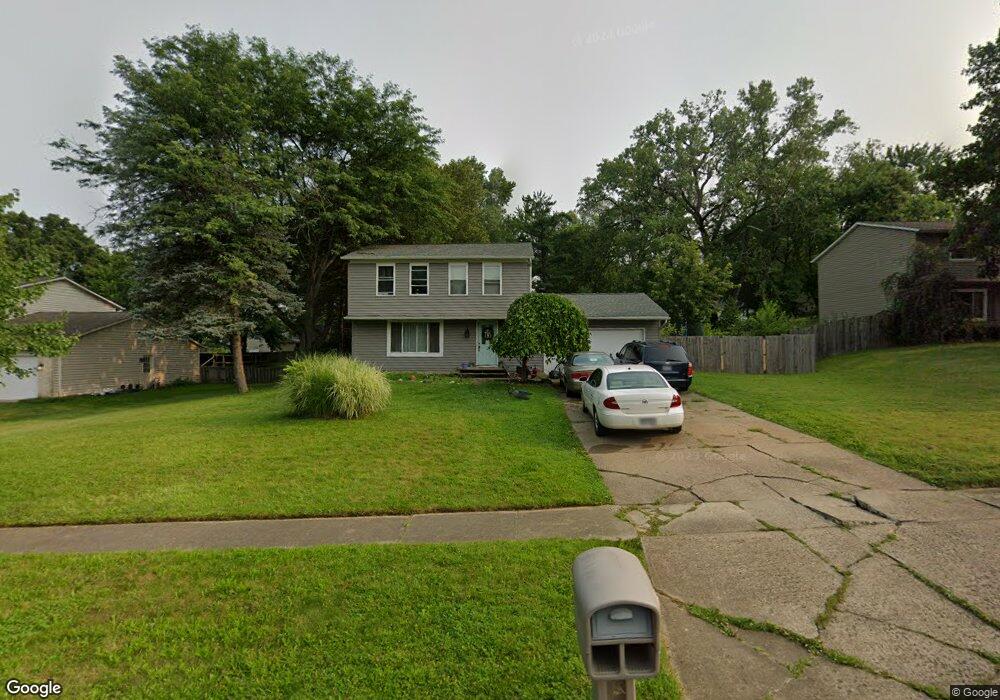
8666 N Gateway Dr North Royalton, OH 44133
Estimated Value: $283,000 - $348,000
3
Beds
2
Baths
1,572
Sq Ft
$199/Sq Ft
Est. Value
About This Home
This home is located at 8666 N Gateway Dr, North Royalton, OH 44133 and is currently estimated at $312,798, approximately $198 per square foot. 8666 N Gateway Dr is a home located in Cuyahoga County with nearby schools including North Royalton Middle School, North Royalton High School, and Royal Redeemer Lutheran School.
Ownership History
Date
Name
Owned For
Owner Type
Purchase Details
Closed on
Nov 14, 2002
Sold by
Fox Madeline M
Bought by
Tranter Lance C and Tranter Deannea L
Current Estimated Value
Home Financials for this Owner
Home Financials are based on the most recent Mortgage that was taken out on this home.
Original Mortgage
$157,172
Outstanding Balance
$66,123
Interest Rate
6.08%
Mortgage Type
FHA
Estimated Equity
$246,675
Purchase Details
Closed on
Jun 9, 1998
Sold by
Fox Robert E and Fox Madeline M
Bought by
Fox Robert E and Fox Madeline M
Purchase Details
Closed on
Jun 18, 1986
Sold by
Grasnik Edward R
Bought by
Fox Robert E
Purchase Details
Closed on
Mar 16, 1978
Sold by
C Winslow Const D
Bought by
Grasnik Edward R
Purchase Details
Closed on
Jan 1, 1978
Bought by
Winslow Const D C
Create a Home Valuation Report for This Property
The Home Valuation Report is an in-depth analysis detailing your home's value as well as a comparison with similar homes in the area
Home Values in the Area
Average Home Value in this Area
Purchase History
| Date | Buyer | Sale Price | Title Company |
|---|---|---|---|
| Tranter Lance C | $163,000 | -- | |
| Fox Robert E | -- | -- | |
| Fox Robert E | $79,000 | -- | |
| Grasnik Edward R | $63,500 | -- | |
| Winslow Const D C | -- | -- |
Source: Public Records
Mortgage History
| Date | Status | Borrower | Loan Amount |
|---|---|---|---|
| Open | Tranter Lance C | $157,172 |
Source: Public Records
Tax History Compared to Growth
Tax History
| Year | Tax Paid | Tax Assessment Tax Assessment Total Assessment is a certain percentage of the fair market value that is determined by local assessors to be the total taxable value of land and additions on the property. | Land | Improvement |
|---|---|---|---|---|
| 2024 | $4,152 | $71,470 | $18,655 | $52,815 |
| 2023 | $3,951 | $62,380 | $14,320 | $48,060 |
| 2022 | $3,924 | $62,370 | $14,320 | $48,060 |
| 2021 | $3,965 | $62,370 | $14,320 | $48,060 |
| 2020 | $3,692 | $55,200 | $12,670 | $42,530 |
| 2019 | $3,584 | $157,700 | $36,200 | $121,500 |
| 2018 | $4,262 | $55,200 | $12,670 | $42,530 |
| 2017 | $5,547 | $56,780 | $12,360 | $44,420 |
| 2016 | $4,428 | $56,780 | $12,360 | $44,420 |
| 2015 | $4,774 | $56,780 | $12,360 | $44,420 |
| 2014 | $4,774 | $56,780 | $12,360 | $44,420 |
Source: Public Records
Map
Nearby Homes
- 8381 N Akins Rd Unit H7
- 13831 Woodcroft Trace
- 7400 Akins Rd
- S/L Margaret Dr
- 12906 Cartwright Pkwy
- 13000 Cartwright Pkwy
- 7554 Margaret Dr
- 7595 Margaret Dr
- 7545 Margaret Dr
- 7585 Margaret Dr
- 7575 Margaret Dr
- 7535 Margaret Dr
- 7555 Margaret Dr
- 7600 Margaret Dr
- 7564 Margaret Dr
- 7574 Margaret Dr
- 12701 Gordon St
- 9447 Lindberg Dr
- 9035 Wallings Rd
- 5299 Whistler Ct
- 8634 N Gateway Dr
- 8700 N Gateway Dr
- 8291 Royalton Rd
- 8734 N Gateway Dr
- 8277 Royalton Rd
- 8600 N Gateway Dr
- 8635 N Gateway Dr
- 8701 N Gateway Dr
- 8165 Royalton Rd
- 8261 Royalton Rd
- 8766 N Gateway Dr
- 8733 N Gateway Dr
- 8245 Royalton Rd
- 8337 Royalton Rd
- 8668 Center Dr
- 8636 Center Dr
- 8767 N Gateway Dr
- 8583 Royalton Rd
- 8583 Royalton Rd
- 8798 N Gateway Dr