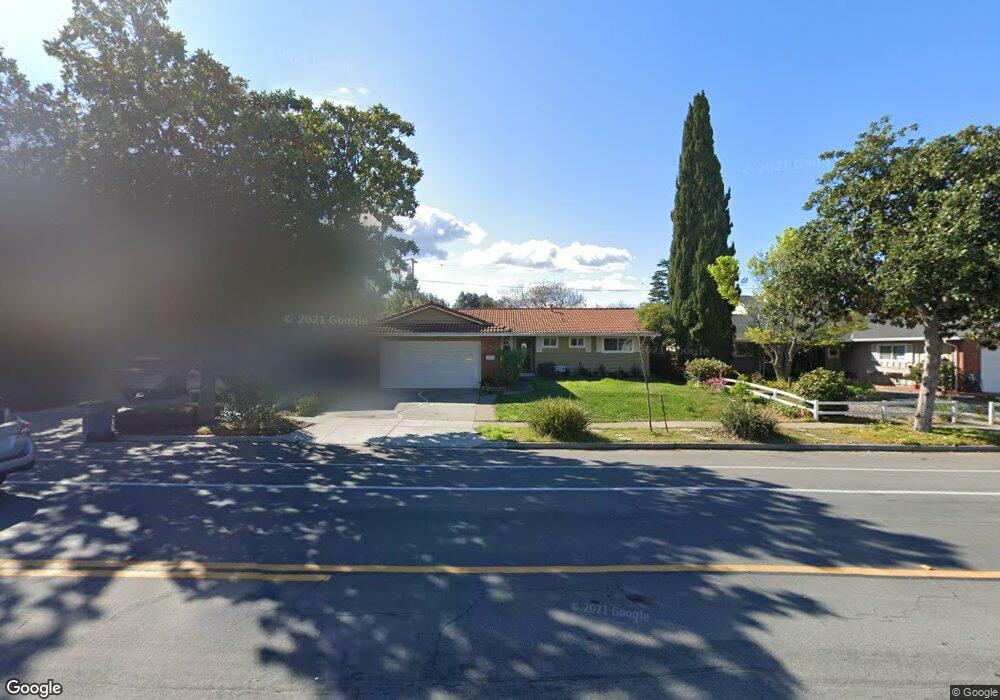
867 S Mary Ave Sunnyvale, CA 94087
Estimated Value: $2,339,000 - $2,761,320
3
Beds
2
Baths
1,356
Sq Ft
$1,876/Sq Ft
Est. Value
About This Home
This home is located at 867 S Mary Ave, Sunnyvale, CA 94087 and is currently estimated at $2,544,080, approximately $1,876 per square foot. 867 S Mary Ave is a home located in Santa Clara County with nearby schools including Cherry Chase Elementary School, Sunnyvale Middle School, and Homestead High School.
Ownership History
Date
Name
Owned For
Owner Type
Purchase Details
Closed on
Sep 8, 2010
Sold by
Foertsch Pamela A
Bought by
Guo Haitao and Zhao Qin
Current Estimated Value
Home Financials for this Owner
Home Financials are based on the most recent Mortgage that was taken out on this home.
Original Mortgage
$606,400
Outstanding Balance
$401,237
Interest Rate
4.48%
Mortgage Type
New Conventional
Estimated Equity
$2,142,843
Purchase Details
Closed on
Jan 10, 2003
Sold by
Mikailli Alireza and Kalanaki Mahnaz
Bought by
Foertsch Pamela A
Home Financials for this Owner
Home Financials are based on the most recent Mortgage that was taken out on this home.
Original Mortgage
$265,000
Interest Rate
6.15%
Purchase Details
Closed on
Jan 26, 1994
Sold by
Han Jesse Chia Chen and Han Su Chu
Bought by
Mikailli Alireza and Kalanaki Mahnaz
Home Financials for this Owner
Home Financials are based on the most recent Mortgage that was taken out on this home.
Original Mortgage
$213,550
Interest Rate
4.5%
Create a Home Valuation Report for This Property
The Home Valuation Report is an in-depth analysis detailing your home's value as well as a comparison with similar homes in the area
Home Values in the Area
Average Home Value in this Area
Purchase History
| Date | Buyer | Sale Price | Title Company |
|---|---|---|---|
| Guo Haitao | $758,000 | Chicago Title Company | |
| Foertsch Pamela A | $565,000 | Financial Title Company | |
| Mikailli Alireza | $240,000 | Santa Clara Land Title Co |
Source: Public Records
Mortgage History
| Date | Status | Borrower | Loan Amount |
|---|---|---|---|
| Open | Guo Haitao | $606,400 | |
| Previous Owner | Foertsch Pamela A | $265,000 | |
| Previous Owner | Mikailli Alireza | $213,550 |
Source: Public Records
Tax History Compared to Growth
Tax History
| Year | Tax Paid | Tax Assessment Tax Assessment Total Assessment is a certain percentage of the fair market value that is determined by local assessors to be the total taxable value of land and additions on the property. | Land | Improvement |
|---|---|---|---|---|
| 2025 | $11,265 | $971,119 | $728,344 | $242,775 |
| 2024 | $11,265 | $952,078 | $714,063 | $238,015 |
| 2023 | $11,162 | $933,411 | $700,062 | $233,349 |
| 2022 | $10,981 | $915,110 | $686,336 | $228,774 |
| 2021 | $10,877 | $897,168 | $672,879 | $224,289 |
| 2020 | $10,742 | $887,970 | $665,980 | $221,990 |
| 2019 | $10,502 | $870,560 | $652,922 | $217,638 |
| 2018 | $10,309 | $853,491 | $640,120 | $213,371 |
| 2017 | $10,177 | $836,757 | $627,569 | $209,188 |
| 2016 | $9,783 | $820,351 | $615,264 | $205,087 |
| 2015 | $9,840 | $808,030 | $606,023 | $202,007 |
| 2014 | $9,648 | $792,202 | $594,152 | $198,050 |
Source: Public Records
Map
Nearby Homes
- 960 Heatherstone Ave
- 857 Peach Ave
- 1201 Heatherstone Way
- 745 Reseda Dr
- 1072 Syracuse Dr
- 654 Princeton Dr
- 1244 Elderberry Dr
- 541 Holthouse Terrace
- 1033 Crestview Dr Unit 308
- 1127 Viscaino Ave
- 434 Purisima Ave
- 2721 Fairbrook Dr
- 1262 Riesling Terrace
- 1021 Golf Ct
- 1296 Riesling Terrace
- 246 Leota Ave
- 128 Brahms Way
- 839 Coolidge Ave
- 1402 Bedford Ave
- 1308 Yarmouth Terrace
- 865 S Mary Ave
- 869 S Mary Ave
- 854 Maranta Ave
- 862 Maranta Ave
- 871 S Mary Ave
- 863 S Mary Ave
- 850 Maranta Ave
- 866 Maranta Ave
- 875 S Mary Ave
- 874 S Mary Ave Unit 1
- 870 S Mary Ave
- 878 S Mary Ave Unit 1
- 870 Maranta Ave
- 868 S Mary Ave
- 880 S Mary Ave
- 879 S Mary Ave
- 859 Maranta Ave
- 837 Maranta Ave
- 864 S Mary Ave
- 874 Maranta Ave