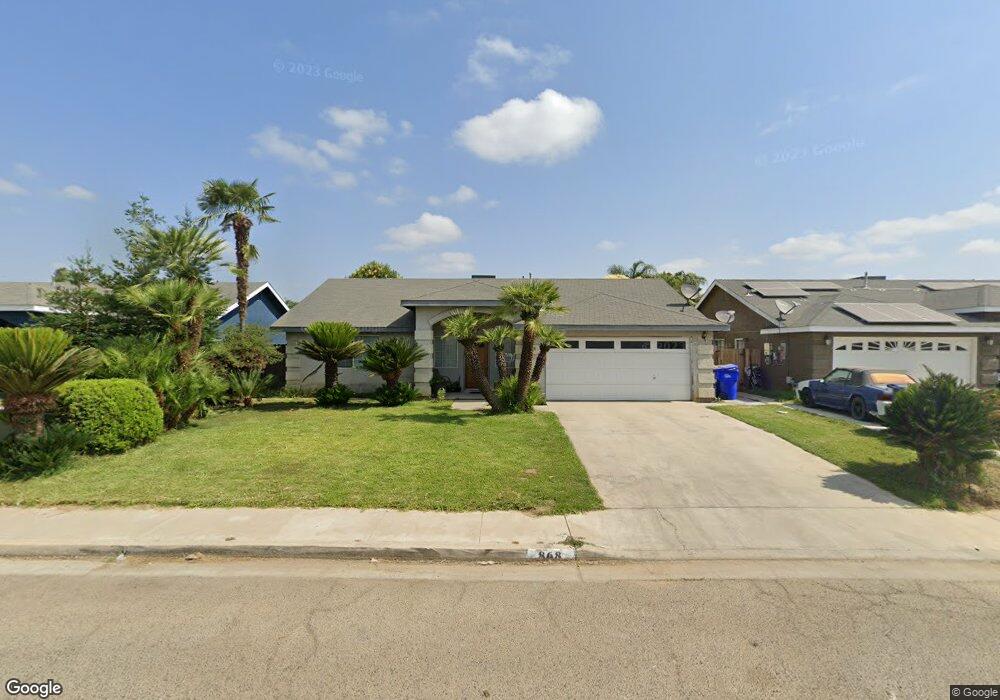
868 W Qualls Ct Farmersville, CA 93223
Estimated Value: $310,000 - $328,000
4
Beds
2
Baths
1,368
Sq Ft
$231/Sq Ft
Est. Value
About This Home
This home is located at 868 W Qualls Ct, Farmersville, CA 93223 and is currently estimated at $315,346, approximately $230 per square foot. 868 W Qualls Ct is a home located in Tulare County with nearby schools including George L. Snowden Elementary School, J.E. Hester Elementary School, and Freedom Elementary School.
Ownership History
Date
Name
Owned For
Owner Type
Purchase Details
Closed on
Feb 24, 2025
Sold by
Barajas Marysela
Bought by
Espinoza Noel
Current Estimated Value
Purchase Details
Closed on
Nov 16, 2022
Sold by
Fernandez Rebeca
Bought by
Barajas Marysela
Purchase Details
Closed on
Jun 27, 2011
Sold by
Moreno Manuel Espinoza
Bought by
Fernandez Rebeca
Purchase Details
Closed on
Sep 7, 2006
Sold by
Espinoza Jaime R
Bought by
Moreno Manuel Espinoza
Purchase Details
Closed on
Mar 20, 1998
Sold by
Reynoso Ranulfo
Bought by
Espinoza Jaime R and Ramos Noel Espinoza
Home Financials for this Owner
Home Financials are based on the most recent Mortgage that was taken out on this home.
Original Mortgage
$87,321
Interest Rate
7.17%
Mortgage Type
FHA
Create a Home Valuation Report for This Property
The Home Valuation Report is an in-depth analysis detailing your home's value as well as a comparison with similar homes in the area
Home Values in the Area
Average Home Value in this Area
Purchase History
| Date | Buyer | Sale Price | Title Company |
|---|---|---|---|
| Espinoza Noel | -- | Total Title Services | |
| Barajas Marysela | -- | -- | |
| Fernandez Rebeca | -- | None Available | |
| Moreno Manuel Espinoza | $77,500 | None Available | |
| Espinoza Jaime R | $88,000 | Fidelity National Title Co |
Source: Public Records
Mortgage History
| Date | Status | Borrower | Loan Amount |
|---|---|---|---|
| Previous Owner | Espinoza Jaime R | $87,321 |
Source: Public Records
Tax History Compared to Growth
Tax History
| Year | Tax Paid | Tax Assessment Tax Assessment Total Assessment is a certain percentage of the fair market value that is determined by local assessors to be the total taxable value of land and additions on the property. | Land | Improvement |
|---|---|---|---|---|
| 2025 | $3,278 | $296,514 | $72,828 | $223,686 |
| 2024 | $3,278 | $290,700 | $71,400 | $219,300 |
| 2023 | $1,566 | $133,525 | $38,370 | $95,155 |
| 2022 | $1,453 | $130,908 | $37,618 | $93,290 |
| 2021 | $1,426 | $128,341 | $36,880 | $91,461 |
| 2020 | $1,415 | $127,025 | $36,502 | $90,523 |
| 2019 | $1,428 | $124,534 | $35,786 | $88,748 |
| 2018 | $1,391 | $122,092 | $35,084 | $87,008 |
| 2017 | $1,404 | $119,698 | $34,396 | $85,302 |
| 2016 | $1,330 | $117,351 | $33,722 | $83,629 |
| 2015 | $1,273 | $115,588 | $33,215 | $82,373 |
| 2014 | $1,273 | $113,323 | $32,564 | $80,759 |
Source: Public Records
Map
Nearby Homes
- 245 W Oakland St
- 327 S Farmersville Blvd
- 209 S Magnolia Ave
- 528 S Camelia Ave
- 896 N Mariposa Ave
- 438 N Magnolia Ave
- 701 Farmersville Rd
- 896 Farmersville Rd
- 680 E Larry St
- 738 E Larry St
- 885 E Ash St
- 188 E Citrus Dr
- 903 E Ash St
- 322 E Citrus Dr
- 732 N Dwight Ave
- 1643 Tehama Ave
- 0 Apn 128-030-056-000 Unit 218742
- 0 Avenue 288
- 753 N Brundage Ave
- 0 Avenue 288