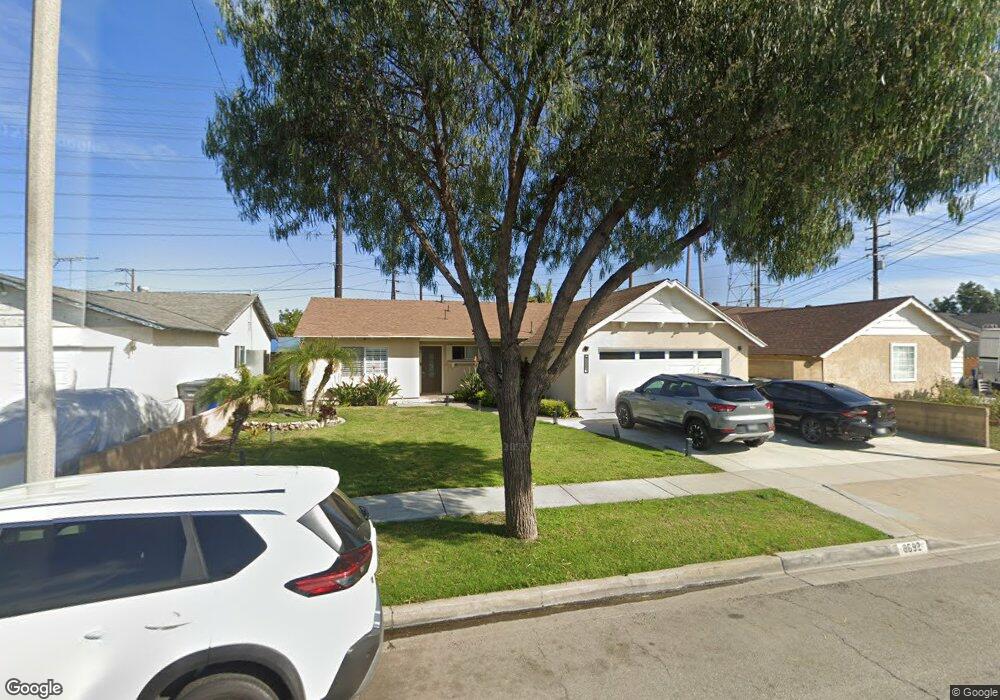
8692 Tamarack Way Buena Park, CA 90620
Estimated Value: $964,000 - $1,080,000
4
Beds
2
Baths
1,872
Sq Ft
$534/Sq Ft
Est. Value
About This Home
This home is located at 8692 Tamarack Way, Buena Park, CA 90620 and is currently estimated at $999,373, approximately $533 per square foot. 8692 Tamarack Way is a home located in Orange County with nearby schools including Glen H. Dysinger Sr. Elementary School, Brookhurst Junior High School, and Savanna High School.
Ownership History
Date
Name
Owned For
Owner Type
Purchase Details
Closed on
Apr 28, 2021
Sold by
Mobley Stacy A and The James And Nancy Mobley Liv
Bought by
Martinez Jose Gerardo Corona and Martinez Hector M
Current Estimated Value
Home Financials for this Owner
Home Financials are based on the most recent Mortgage that was taken out on this home.
Original Mortgage
$651,950
Outstanding Balance
$590,830
Interest Rate
3.1%
Mortgage Type
New Conventional
Estimated Equity
$408,544
Purchase Details
Closed on
Feb 14, 2015
Sold by
Mobley James T and Mobley Nancy D
Bought by
James & Nancy Mobley Living Trust
Home Financials for this Owner
Home Financials are based on the most recent Mortgage that was taken out on this home.
Original Mortgage
$270,000
Interest Rate
3.6%
Mortgage Type
New Conventional
Purchase Details
Closed on
Jun 5, 2006
Sold by
Mobley James T and Mobley Nancy D
Bought by
Mobley James T and Mobley Nancy D
Create a Home Valuation Report for This Property
The Home Valuation Report is an in-depth analysis detailing your home's value as well as a comparison with similar homes in the area
Home Values in the Area
Average Home Value in this Area
Purchase History
| Date | Buyer | Sale Price | Title Company |
|---|---|---|---|
| Martinez Jose Gerardo Corona | $767,000 | Stewart Title | |
| James & Nancy Mobley Living Trust | -- | None Available | |
| Mobley James T | -- | None Available | |
| Mobley James T | -- | None Available |
Source: Public Records
Mortgage History
| Date | Status | Borrower | Loan Amount |
|---|---|---|---|
| Open | Martinez Jose Gerardo Corona | $651,950 | |
| Previous Owner | Mobley James T | $270,000 |
Source: Public Records
Tax History Compared to Growth
Tax History
| Year | Tax Paid | Tax Assessment Tax Assessment Total Assessment is a certain percentage of the fair market value that is determined by local assessors to be the total taxable value of land and additions on the property. | Land | Improvement |
|---|---|---|---|---|
| 2025 | $9,323 | $830,223 | $729,249 | $100,974 |
| 2024 | $9,323 | $813,945 | $714,950 | $98,995 |
| 2023 | $9,095 | $797,986 | $700,932 | $97,054 |
| 2022 | $8,986 | $782,340 | $687,189 | $95,151 |
| 2021 | $1,274 | $88,504 | $25,009 | $63,495 |
| 2020 | $1,264 | $87,597 | $24,753 | $62,844 |
| 2019 | $1,238 | $85,880 | $24,268 | $61,612 |
| 2018 | $1,216 | $84,197 | $23,793 | $60,404 |
| 2017 | $1,182 | $82,547 | $23,327 | $59,220 |
| 2016 | $1,160 | $80,929 | $22,870 | $58,059 |
| 2015 | $1,145 | $79,714 | $22,527 | $57,187 |
| 2014 | $1,094 | $78,153 | $22,086 | $56,067 |
Source: Public Records
Map
Nearby Homes
- 8054 Teakwood Cir
- 8319 Hickory Dr
- 8434 Periwinkle Dr
- 605 N La Reina St
- 21 Centerstone Cir
- 2625 W Cameron Ct Unit 121
- 2544 W Greenacre Ave
- 1006 N Hampton Place
- 2697 W Parkside Ln
- 1028 N Mayflower St
- 2709 W Madison Cir
- 400 N Syracuse St
- 8194 Calendula Dr
- 8026 Carnation Dr
- 8452 Stanton Ave
- 8133 Canterbury Way
- 2955 W Lincoln Ave Unit 7
- 728 N Geneva St
- 2540 W Picadilly Way
- 199 N Magnolia Ave Unit B
- 8702 Tamarack Way
- 8682 Tamarack Way
- 8712 Tamarack Way
- 8672 Tamarack Way
- 8671 Tamarack Way
- 8681 Tamarack Way
- 8722 Tamarack Way
- 8661 Tamarack Way
- 8662 Tamarack Way
- 8691 Tamarack Way
- 8651 Tamarack Way
- 8701 Tamarack Way
- 8732 Tamarack Way
- 8066 Teakwood Cir
- 8078 Teakwood Cir
- 8652 Tamarack Way
- 8042 Teakwood Cir
- 8711 Tamarack Way
- 8090 Teakwood Cir
- 8642 Tamarack Way