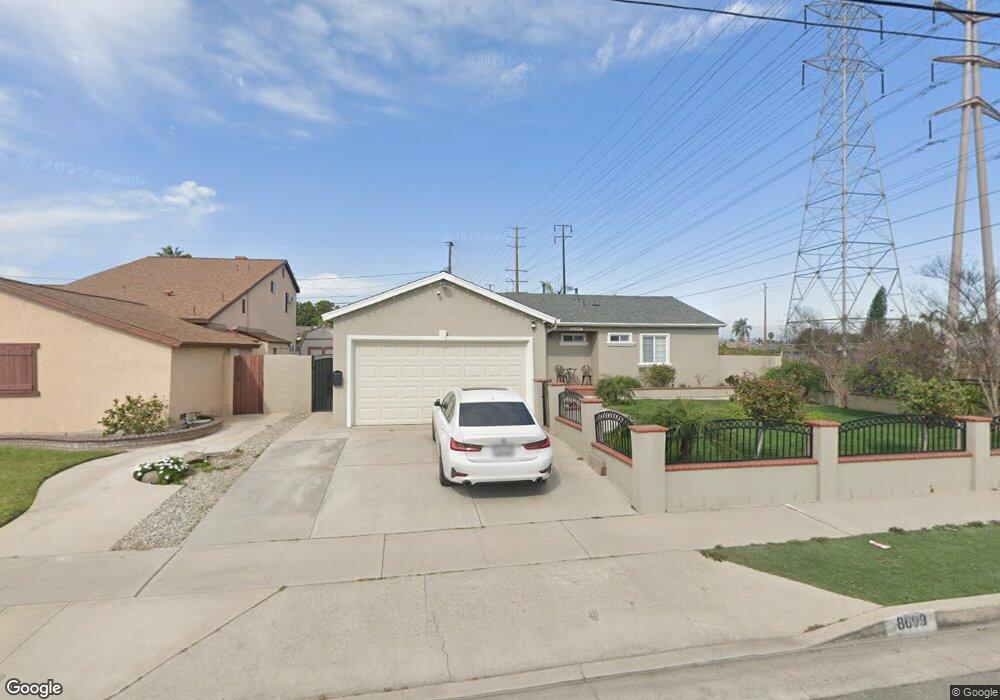
8699 Crescent Ave Buena Park, CA 90620
Estimated Value: $744,000 - $1,005,000
3
Beds
2
Baths
1,171
Sq Ft
$722/Sq Ft
Est. Value
About This Home
This home is located at 8699 Crescent Ave, Buena Park, CA 90620 and is currently estimated at $844,965, approximately $721 per square foot. 8699 Crescent Ave is a home located in Orange County with nearby schools including Dr. Peter Marshall Elementary School, Brookhurst Junior High School, and Savanna High School.
Ownership History
Date
Name
Owned For
Owner Type
Purchase Details
Closed on
Apr 12, 2004
Sold by
Giron William A and Giron Maria Leticia
Bought by
Giron William A and Giron Maria Leticia
Current Estimated Value
Home Financials for this Owner
Home Financials are based on the most recent Mortgage that was taken out on this home.
Original Mortgage
$263,250
Outstanding Balance
$123,104
Interest Rate
5.57%
Mortgage Type
New Conventional
Estimated Equity
$721,861
Purchase Details
Closed on
Jun 3, 2002
Sold by
Giron William Alexander
Bought by
Giron William Alexander and Giron Maria Leticia
Home Financials for this Owner
Home Financials are based on the most recent Mortgage that was taken out on this home.
Original Mortgage
$200,000
Interest Rate
6.83%
Purchase Details
Closed on
May 20, 2002
Sold by
Middlebrook Irene C
Bought by
Giron William Alexander
Home Financials for this Owner
Home Financials are based on the most recent Mortgage that was taken out on this home.
Original Mortgage
$200,000
Interest Rate
6.83%
Create a Home Valuation Report for This Property
The Home Valuation Report is an in-depth analysis detailing your home's value as well as a comparison with similar homes in the area
Home Values in the Area
Average Home Value in this Area
Purchase History
| Date | Buyer | Sale Price | Title Company |
|---|---|---|---|
| Giron William A | -- | Gateway Title | |
| Giron William Alexander | -- | Chicago Title Co | |
| Giron William Alexander | -- | Chicago Title Co | |
| Giron William Alexander | $200,000 | Chicago Title Co |
Source: Public Records
Mortgage History
| Date | Status | Borrower | Loan Amount |
|---|---|---|---|
| Open | Giron William A | $263,250 | |
| Closed | Giron William Alexander | $200,000 |
Source: Public Records
Tax History Compared to Growth
Tax History
| Year | Tax Paid | Tax Assessment Tax Assessment Total Assessment is a certain percentage of the fair market value that is determined by local assessors to be the total taxable value of land and additions on the property. | Land | Improvement |
|---|---|---|---|---|
| 2025 | $4,150 | $354,538 | $287,010 | $67,528 |
| 2024 | $4,150 | $347,587 | $281,383 | $66,204 |
| 2023 | $4,042 | $340,772 | $275,866 | $64,906 |
| 2022 | $4,001 | $334,091 | $270,457 | $63,634 |
| 2021 | $3,954 | $327,541 | $265,154 | $62,387 |
| 2020 | $3,932 | $324,183 | $262,435 | $61,748 |
| 2019 | $3,837 | $317,827 | $257,289 | $60,538 |
| 2018 | $3,791 | $311,596 | $252,245 | $59,351 |
| 2017 | $3,659 | $305,487 | $247,299 | $58,188 |
| 2016 | $3,642 | $299,498 | $242,450 | $57,048 |
| 2015 | $3,605 | $295,000 | $238,808 | $56,192 |
| 2014 | $3,427 | $289,222 | $234,130 | $55,092 |
Source: Public Records
Map
Nearby Homes
- 605 N La Reina St
- 8319 Hickory Dr
- 400 N Syracuse St
- 2709 W Madison Cir
- 8054 Teakwood Cir
- 2544 W Greenacre Ave
- 199 N Magnolia Ave Unit B
- 2955 W Lincoln Ave Unit 7
- 2871 W Tyler Ave
- 1006 N Hampton Place
- 8434 Periwinkle Dr
- 2770 W Lincoln Ave Unit 40
- 2770 W Lincoln Ave Unit 58
- 525 N Gilbert St Unit 106
- 525 N Gilbert St Unit 151
- 8452 Stanton Ave
- 2943 W Lincoln Ave
- 728 N Geneva St
- 21 Centerstone Cir
- Plan Two at Mason
- 8685 Crescent Ave
- 8628 Holly Way
- 8673 Crescent Ave
- 534 N Colorado St
- 8622 Holly Way
- 8634 Holly Way
- 8661 Crescent Ave
- 8616 Holly Way
- 530 N Colorado St
- 2736 W Crescent Ave
- 8649 Crescent Ave
- 8640 Holly Way
- 8610 Holly Way
- 526 N Colorado St
- 8615 Holly Way
- 2742 W Crescent Ave
- 8637 Crescent Ave
- 8646 Holly Way
- 2737 W Stockton Ave
- 8604 Holly Way