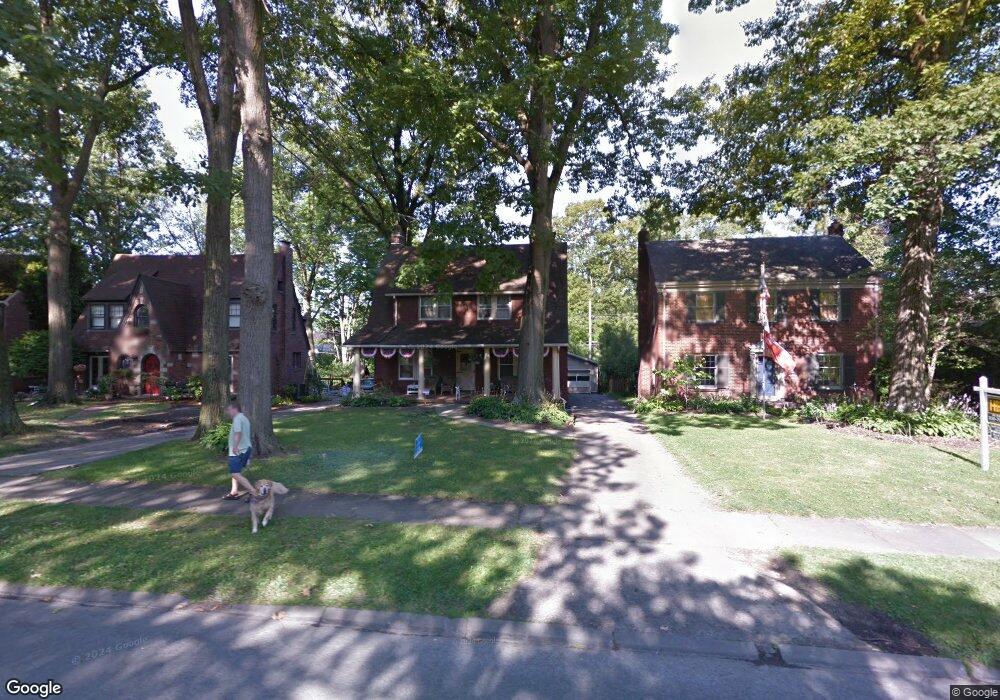
87 Jennette Dr Youngstown, OH 44512
Estimated Value: $167,000 - $191,000
3
Beds
2
Baths
1,806
Sq Ft
$99/Sq Ft
Est. Value
About This Home
This home is located at 87 Jennette Dr, Youngstown, OH 44512 and is currently estimated at $178,699, approximately $98 per square foot. 87 Jennette Dr is a home located in Mahoning County with nearby schools including Boardman Center Middle School, Boardman High School, and Horizon Science Academy - Youngstown.
Ownership History
Date
Name
Owned For
Owner Type
Purchase Details
Closed on
Apr 10, 2024
Sold by
Lucci Vincenzo and Lucci Kathleen Diane
Bought by
Deniro Christl L and Deniro Kimo M
Current Estimated Value
Home Financials for this Owner
Home Financials are based on the most recent Mortgage that was taken out on this home.
Original Mortgage
$7,650
Outstanding Balance
$7,580
Interest Rate
9.4%
Estimated Equity
$171,119
Purchase Details
Closed on
Mar 31, 1995
Sold by
Mayo & Orvets Inc
Bought by
Lucci Vincenzo and Lucci Kathleen D
Home Financials for this Owner
Home Financials are based on the most recent Mortgage that was taken out on this home.
Original Mortgage
$76,500
Interest Rate
8.25%
Mortgage Type
New Conventional
Purchase Details
Closed on
Dec 2, 1993
Bought by
Boardman Enterprises Inc
Create a Home Valuation Report for This Property
The Home Valuation Report is an in-depth analysis detailing your home's value as well as a comparison with similar homes in the area
Home Values in the Area
Average Home Value in this Area
Purchase History
| Date | Buyer | Sale Price | Title Company |
|---|---|---|---|
| Deniro Christl L | $153,000 | None Listed On Document | |
| Deniro Christl L | $153,000 | None Listed On Document | |
| Lucci Vincenzo | $90,000 | -- | |
| Boardman Enterprises Inc | $85,100 | -- |
Source: Public Records
Mortgage History
| Date | Status | Borrower | Loan Amount |
|---|---|---|---|
| Open | Deniro Christl L | $7,650 | |
| Open | Deniro Christl L | $145,350 | |
| Closed | Deniro Christl L | $145,350 | |
| Previous Owner | Lucci Vincenzo | $76,500 |
Source: Public Records
Tax History Compared to Growth
Tax History
| Year | Tax Paid | Tax Assessment Tax Assessment Total Assessment is a certain percentage of the fair market value that is determined by local assessors to be the total taxable value of land and additions on the property. | Land | Improvement |
|---|---|---|---|---|
| 2024 | $2,673 | $50,690 | $4,790 | $45,900 |
| 2023 | $2,638 | $29,470 | $4,630 | $24,840 |
| 2022 | $2,023 | $29,470 | $4,630 | $24,840 |
| 2021 | $2,025 | $29,470 | $4,630 | $24,840 |
| 2020 | $2,035 | $29,470 | $4,630 | $24,840 |
| 2019 | $2,019 | $25,400 | $3,990 | $21,410 |
| 2018 | $1,737 | $25,400 | $3,990 | $21,410 |
| 2017 | $1,693 | $25,400 | $3,990 | $21,410 |
| 2016 | $1,421 | $21,000 | $4,990 | $16,010 |
| 2015 | $1,394 | $21,000 | $4,990 | $16,010 |
| 2014 | $1,398 | $21,000 | $4,990 | $16,010 |
| 2013 | $1,382 | $21,000 | $4,990 | $16,010 |
Source: Public Records
Map
Nearby Homes
- 4250 Oak Knoll Dr
- 117 Overhill Rd
- 4225 Stratford Rd
- 4141 Windsor Rd
- 30 Pinehurst Ave
- 60 Shadyside Dr
- 4018 Windsor Rd
- 4307 Helena Ave
- 4144 Helena Ave
- 28 Terrace Dr
- 94 Shadyside Dr
- 4504 Southern Blvd
- 4508 Southern Blvd
- 94 Beechwood Dr
- 83 Beechwood Dr
- 3916 Howard St
- 5020 Friendship Ave
- 447 Mistletoe Ave
- 272 Shields Rd
- 3726 Glenwood Ave
- 91 Jennette Dr
- 83 Jennette Dr
- 75 Jennette Dr
- 107 Jennette Dr
- 109 Jennette Dr
- 4251 Oak Knoll Dr
- 4237 Oak Knoll Dr
- 88 Jennette Dr
- 94 Jennette Dr
- 4257 Oak Knoll Dr
- 98 Jennette Dr
- 67 Jennette Dr
- 111 Jennette Dr
- 76 Jennette Dr
- 4263 Oak Knoll Dr
- 102 Jennette Dr
- 4229 Oak Knoll Dr
- 108 Jennette Dr
- 115 Jennette Dr
- 4271 Oak Knoll Dr