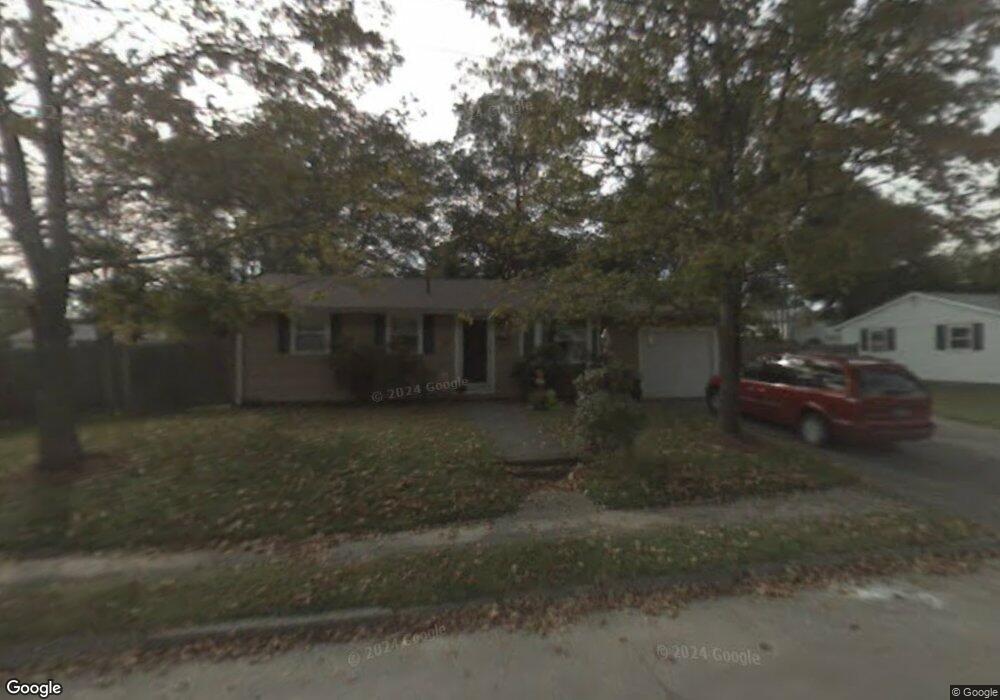
87 Josh Gray Rd Rockland, MA 02370
Estimated Value: $397,000 - $491,242
3
Beds
1
Bath
950
Sq Ft
$474/Sq Ft
Est. Value
About This Home
This home is located at 87 Josh Gray Rd, Rockland, MA 02370 and is currently estimated at $450,311, approximately $474 per square foot. 87 Josh Gray Rd is a home located in Plymouth County with nearby schools including Rockland Senior High School, Calvary Chapel Academy, and Holy Family Elementary School.
Ownership History
Date
Name
Owned For
Owner Type
Purchase Details
Closed on
Oct 31, 2006
Sold by
Mullen Joseph T
Bought by
Mullen Joseph T and Mullen Patricia
Current Estimated Value
Home Financials for this Owner
Home Financials are based on the most recent Mortgage that was taken out on this home.
Original Mortgage
$145,000
Outstanding Balance
$87,064
Interest Rate
6.48%
Mortgage Type
Purchase Money Mortgage
Estimated Equity
$363,247
Purchase Details
Closed on
Aug 15, 1997
Sold by
Doherty Virginia M
Bought by
Mullen Joseph T and Hartnett Cheryl A
Home Financials for this Owner
Home Financials are based on the most recent Mortgage that was taken out on this home.
Original Mortgage
$123,211
Interest Rate
7.56%
Mortgage Type
Purchase Money Mortgage
Purchase Details
Closed on
Jan 26, 1996
Sold by
Aldersley John P and Aldersley Jyvonne M
Bought by
Doherty Virginia M
Home Financials for this Owner
Home Financials are based on the most recent Mortgage that was taken out on this home.
Original Mortgage
$120,650
Interest Rate
7.13%
Mortgage Type
Purchase Money Mortgage
Create a Home Valuation Report for This Property
The Home Valuation Report is an in-depth analysis detailing your home's value as well as a comparison with similar homes in the area
Home Values in the Area
Average Home Value in this Area
Purchase History
| Date | Buyer | Sale Price | Title Company |
|---|---|---|---|
| Mullen Joseph T | -- | -- | |
| Mullen Joseph T | $127,000 | -- | |
| Doherty Virginia M | $127,000 | -- |
Source: Public Records
Mortgage History
| Date | Status | Borrower | Loan Amount |
|---|---|---|---|
| Open | Doherty Virginia M | $145,000 | |
| Previous Owner | Doherty Virginia M | $123,211 | |
| Previous Owner | Doherty Virginia M | $120,650 |
Source: Public Records
Tax History Compared to Growth
Tax History
| Year | Tax Paid | Tax Assessment Tax Assessment Total Assessment is a certain percentage of the fair market value that is determined by local assessors to be the total taxable value of land and additions on the property. | Land | Improvement |
|---|---|---|---|---|
| 2025 | $5,803 | $424,500 | $224,400 | $200,100 |
| 2024 | $5,632 | $400,600 | $211,700 | $188,900 |
| 2023 | $5,595 | $367,600 | $194,200 | $173,400 |
| 2022 | $5,390 | $321,800 | $168,800 | $153,000 |
| 2021 | $4,970 | $287,600 | $153,500 | $134,100 |
| 2020 | $4,795 | $274,000 | $146,200 | $127,800 |
| 2019 | $4,681 | $261,200 | $139,300 | $121,900 |
| 2018 | $4,347 | $238,600 | $139,300 | $99,300 |
| 2017 | $4,245 | $229,700 | $139,300 | $90,400 |
| 2016 | $4,090 | $221,200 | $133,900 | $87,300 |
| 2015 | $3,913 | $205,600 | $125,200 | $80,400 |
| 2014 | $3,696 | $201,500 | $122,700 | $78,800 |
Source: Public Records
Map
Nearby Homes
- 83 Josh Gray Rd
- 91 Josh Gray Rd
- 11 Pine Hill Terrace
- 15 Pine Hill Terrace
- 84 Josh Gray Rd
- 7 Pine Hill Terrace
- 88 Josh Gray Rd
- 95 Josh Gray Rd
- 80 Josh Gray Rd
- 21 Pine Hill Terrace
- 92 Josh Gray Rd
- 281 Moncrief Rd
- 281 Moncrief Rd
- 12 Pine Hill Terrace
- 76 Josh Gray Rd
- 73 Josh Gray Rd
- 99 Josh Gray Rd
- 8 Pine Hill Terrace
- 16 Pine Hill Terrace
- 96 Josh Gray Rd