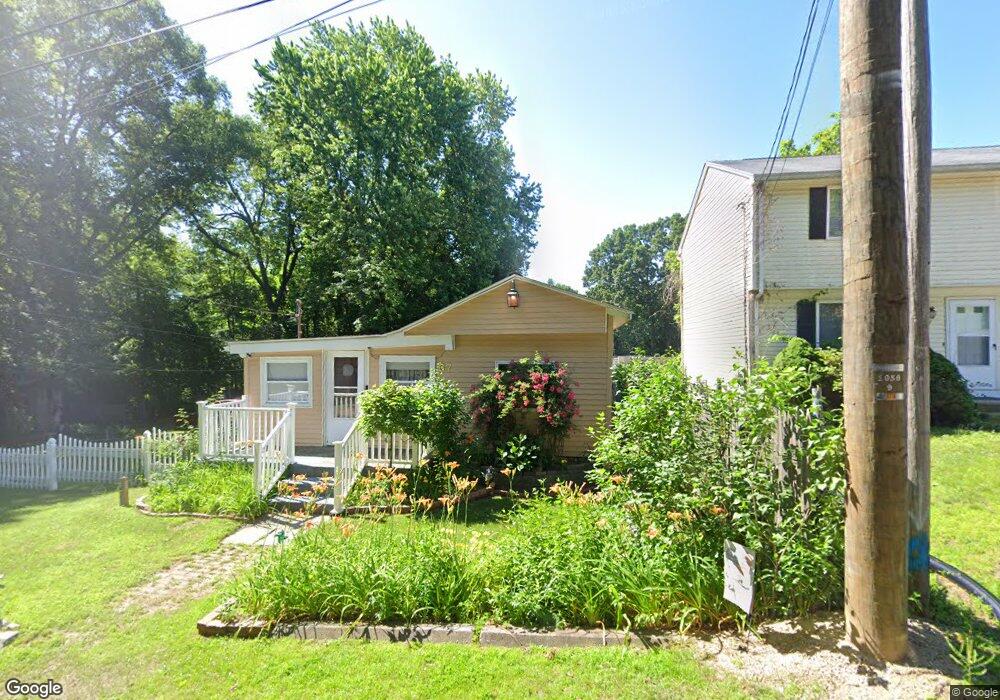
87 Michon St Indian Orchard, MA 01151
Indian Orchard NeighborhoodEstimated Value: $194,000 - $268,000
3
Beds
1
Bath
1,150
Sq Ft
$205/Sq Ft
Est. Value
About This Home
This home is located at 87 Michon St, Indian Orchard, MA 01151 and is currently estimated at $235,414, approximately $204 per square foot. 87 Michon St is a home located in Hampden County with nearby schools including Warner, John F. Kennedy Academy, and Roger L. Putnam Vocational Technical Academy.
Ownership History
Date
Name
Owned For
Owner Type
Purchase Details
Closed on
Apr 16, 1997
Sold by
Thomas Willie K and Thomas Theresa A
Bought by
Nadeau Leland A and Nadeau Crystal L
Current Estimated Value
Home Financials for this Owner
Home Financials are based on the most recent Mortgage that was taken out on this home.
Original Mortgage
$33,900
Interest Rate
7.76%
Mortgage Type
Purchase Money Mortgage
Create a Home Valuation Report for This Property
The Home Valuation Report is an in-depth analysis detailing your home's value as well as a comparison with similar homes in the area
Home Values in the Area
Average Home Value in this Area
Purchase History
| Date | Buyer | Sale Price | Title Company |
|---|---|---|---|
| Nadeau Leland A | $35,000 | -- |
Source: Public Records
Mortgage History
| Date | Status | Borrower | Loan Amount |
|---|---|---|---|
| Open | Nadeau Leland A | $65,000 | |
| Closed | Nadeau Leland A | $33,900 |
Source: Public Records
Tax History Compared to Growth
Tax History
| Year | Tax Paid | Tax Assessment Tax Assessment Total Assessment is a certain percentage of the fair market value that is determined by local assessors to be the total taxable value of land and additions on the property. | Land | Improvement |
|---|---|---|---|---|
| 2025 | $2,289 | $146,000 | $43,600 | $102,400 |
| 2024 | $2,255 | $140,400 | $40,800 | $99,600 |
| 2023 | $2,148 | $126,000 | $33,400 | $92,600 |
| 2022 | $1,814 | $96,400 | $31,200 | $65,200 |
| 2021 | $1,992 | $105,400 | $28,400 | $77,000 |
| 2020 | $2,082 | $106,600 | $28,400 | $78,200 |
| 2019 | $1,610 | $81,800 | $29,400 | $52,400 |
| 2018 | $1,787 | $90,800 | $29,400 | $61,400 |
| 2017 | $1,669 | $84,900 | $25,000 | $59,900 |
| 2016 | $1,457 | $74,100 | $25,000 | $49,100 |
| 2015 | $1,456 | $74,000 | $25,000 | $49,000 |
Source: Public Records
Map
Nearby Homes
- 0 Michon St
- 140 Cardinal St
- 97-99 Pine Grove St
- 98 Pine Grove St
- 89 Pine Grove St
- 31 Wing St
- 34 Temby St
- 61 Glenmore St
- 49 Mohegan Ave
- 501 Oak St
- 70 Nagle St
- 25 Pioneer Way
- 189 Essex St Unit H
- 130 Mazarin St
- 32 Better Way
- 70 Shumway St Unit 29
- 70 Shumway St Unit A1
- 37 Champlain Ave
- 252 Parker St
- 105 Mazarin St
- 97 Michon St Unit 99
- 103 Michon St Unit 105
- 0 Michon St
- 90 Michon St
- 109 Michon St
- 32 Albert St
- 113 Michon St
- 114 Cardinal St
- 91 Dubois St
- 95 Dubois St Unit 97
- 117-119 Michon St
- 117 Michon St Unit 119
- 40 Albert St
- 114 Michon St
- 105 Dubois St
- 118 Cardinal St
- 127 Farnham Ave
- 71 Dubois St Unit 73
- 137 Farnham Ave
- 115 Dubois St