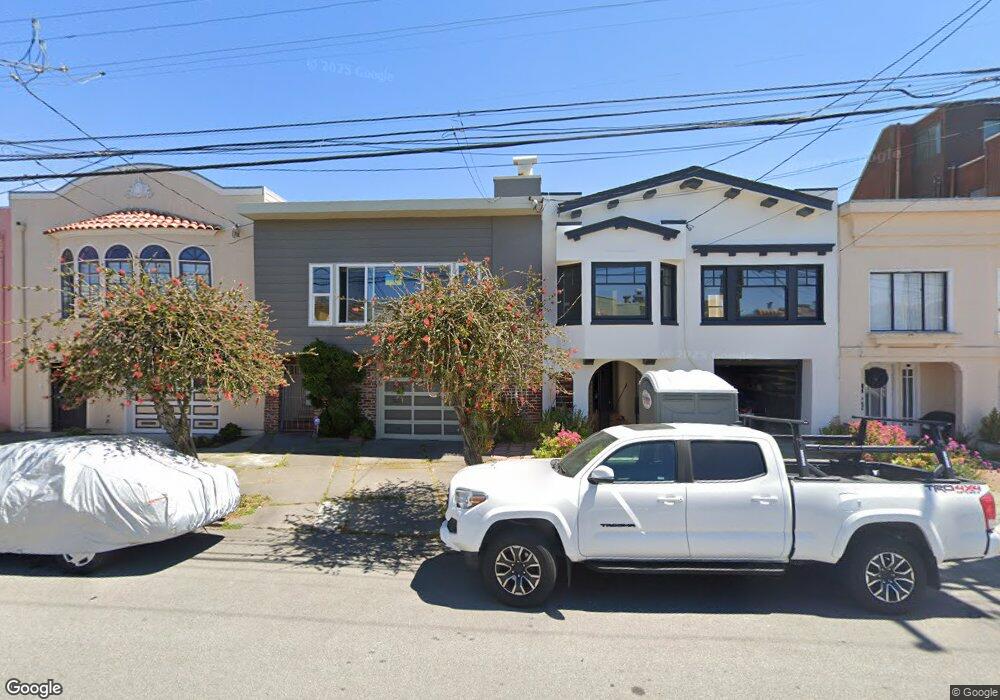
870 41st Ave San Francisco, CA 94121
Outer Richmond NeighborhoodEstimated Value: $1,074,000 - $2,123,000
4
Beds
1
Bath
1,976
Sq Ft
$816/Sq Ft
Est. Value
About This Home
This home is located at 870 41st Ave, San Francisco, CA 94121 and is currently estimated at $1,613,298, approximately $816 per square foot. 870 41st Ave is a home located in San Francisco County with nearby schools including Lafayette Elementary School, Presidio Middle School, and St. Thomas The Apostle School.
Ownership History
Date
Name
Owned For
Owner Type
Purchase Details
Closed on
Dec 29, 2015
Sold by
Lam Sach and Vi Celia
Bought by
Lam Vi Family Trust and An Mi Vi Celia
Current Estimated Value
Purchase Details
Closed on
Aug 19, 2008
Sold by
Chee Jeffery and Hoang Jan
Bought by
Lam Sach and Vi Celia
Home Financials for this Owner
Home Financials are based on the most recent Mortgage that was taken out on this home.
Original Mortgage
$217,500
Outstanding Balance
$143,031
Interest Rate
6.37%
Mortgage Type
Purchase Money Mortgage
Estimated Equity
$1,470,267
Purchase Details
Closed on
Dec 10, 1993
Sold by
Chee Jeffery and Hoang Jan
Bought by
Chee Jeffery and Hoang Jan
Home Financials for this Owner
Home Financials are based on the most recent Mortgage that was taken out on this home.
Original Mortgage
$230,000
Interest Rate
4.87%
Create a Home Valuation Report for This Property
The Home Valuation Report is an in-depth analysis detailing your home's value as well as a comparison with similar homes in the area
Home Values in the Area
Average Home Value in this Area
Purchase History
| Date | Buyer | Sale Price | Title Company |
|---|---|---|---|
| Lam Vi Family Trust | -- | None Available | |
| Lam Sach | $290,000 | Fidelity National Title Co | |
| Chee Jeffery | -- | Fidelity National Title |
Source: Public Records
Mortgage History
| Date | Status | Borrower | Loan Amount |
|---|---|---|---|
| Open | Lam Sach | $217,500 | |
| Previous Owner | Chee Jeffery | $230,000 |
Source: Public Records
Tax History Compared to Growth
Tax History
| Year | Tax Paid | Tax Assessment Tax Assessment Total Assessment is a certain percentage of the fair market value that is determined by local assessors to be the total taxable value of land and additions on the property. | Land | Improvement |
|---|---|---|---|---|
| 2025 | $7,780 | $612,384 | $468,942 | $143,442 |
| 2024 | $7,780 | $600,378 | $459,748 | $140,630 |
| 2023 | $7,657 | $588,607 | $450,734 | $137,873 |
| 2022 | $7,500 | $577,067 | $441,897 | $135,170 |
| 2021 | $7,364 | $565,753 | $433,233 | $132,520 |
| 2020 | $7,462 | $559,953 | $428,791 | $131,162 |
| 2019 | $7,161 | $548,975 | $420,384 | $128,591 |
| 2018 | $6,958 | $538,212 | $412,142 | $126,070 |
| 2017 | $6,578 | $527,660 | $404,061 | $123,599 |
| 2016 | $6,452 | $517,315 | $396,139 | $121,176 |
| 2015 | $6,371 | $509,545 | $390,189 | $119,356 |
| 2014 | $6,205 | $499,564 | $382,546 | $117,018 |
Source: Public Records
Map
Nearby Homes
- 855 41st Ave
- 870-872 38th Ave
- 3900 Balboa St
- 883-885 45th Ave
- 5924 Fulton St
- 630 40th Ave
- 851 46th Ave
- 615 42nd Ave
- 878 47th Ave
- 755 46th Ave
- 622 44th Ave
- 577 42nd Ave
- 894 48th Ave
- 5600 Fulton St
- 529-531 37th Ave
- 695 48th Ave
- 875 La Playa St Unit 176
- 875 La Playa St Unit 180
- 668 33rd Ave
- 5635 Anza St