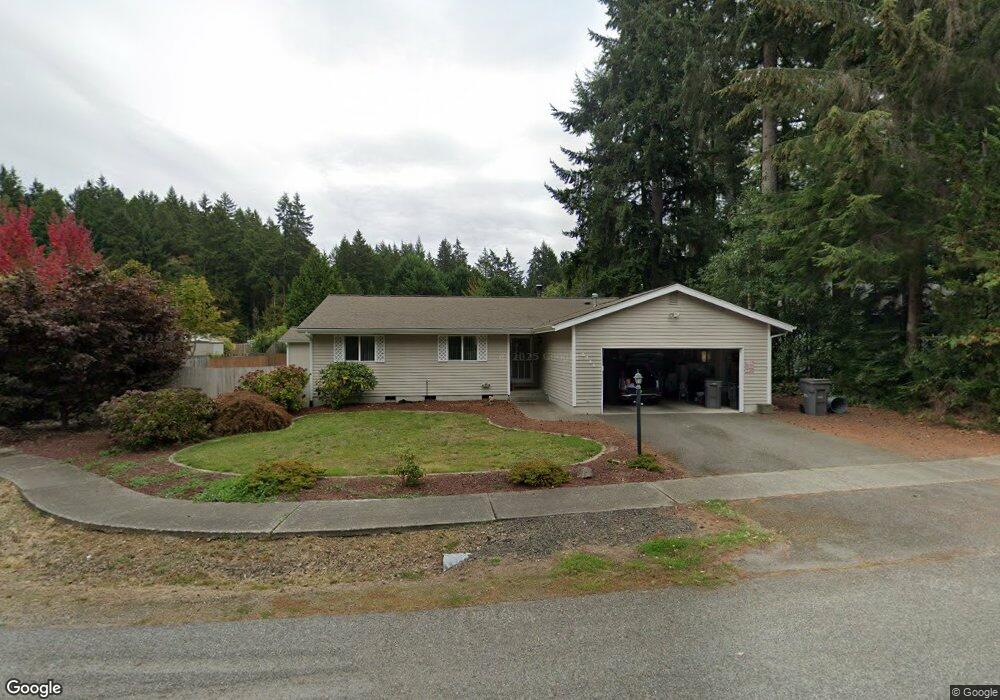
8700 Karolena Place NE Bremerton, WA 98311
Estimated Value: $424,000 - $461,000
3
Beds
2
Baths
1,131
Sq Ft
$390/Sq Ft
Est. Value
About This Home
This home is located at 8700 Karolena Place NE, Bremerton, WA 98311 and is currently estimated at $441,205, approximately $390 per square foot. 8700 Karolena Place NE is a home located in Kitsap County with nearby schools including Cottonwood Elementary School, Fairview Middle School, and Olympic High School.
Ownership History
Date
Name
Owned For
Owner Type
Purchase Details
Closed on
Aug 12, 2002
Sold by
Baker Gary
Bought by
Baker Linda
Current Estimated Value
Home Financials for this Owner
Home Financials are based on the most recent Mortgage that was taken out on this home.
Original Mortgage
$95,000
Outstanding Balance
$40,113
Interest Rate
6.52%
Estimated Equity
$401,092
Purchase Details
Closed on
Aug 5, 2002
Sold by
Oelschlager Troy D
Bought by
Baker Linda J
Home Financials for this Owner
Home Financials are based on the most recent Mortgage that was taken out on this home.
Original Mortgage
$95,000
Outstanding Balance
$40,113
Interest Rate
6.52%
Estimated Equity
$401,092
Purchase Details
Closed on
Jul 30, 1996
Sold by
Jones Joseph J and Rodrigue Danise M
Bought by
Oelschlager Troy D
Home Financials for this Owner
Home Financials are based on the most recent Mortgage that was taken out on this home.
Original Mortgage
$76,000
Interest Rate
8.32%
Mortgage Type
Balloon
Create a Home Valuation Report for This Property
The Home Valuation Report is an in-depth analysis detailing your home's value as well as a comparison with similar homes in the area
Home Values in the Area
Average Home Value in this Area
Purchase History
| Date | Buyer | Sale Price | Title Company |
|---|---|---|---|
| Baker Linda | -- | Land Title Company | |
| Baker Linda J | $145,000 | Land Title Company | |
| Oelschlager Troy D | $96,000 | Charter Title Corporation |
Source: Public Records
Mortgage History
| Date | Status | Borrower | Loan Amount |
|---|---|---|---|
| Open | Baker Linda J | $95,000 | |
| Previous Owner | Oelschlager Troy D | $76,000 |
Source: Public Records
Tax History Compared to Growth
Tax History
| Year | Tax Paid | Tax Assessment Tax Assessment Total Assessment is a certain percentage of the fair market value that is determined by local assessors to be the total taxable value of land and additions on the property. | Land | Improvement |
|---|---|---|---|---|
| 2026 | $3,554 | $373,150 | $109,970 | $263,180 |
| 2025 | $3,554 | $373,150 | $109,970 | $263,180 |
| 2024 | $3,457 | $373,150 | $109,970 | $263,180 |
| 2023 | $3,469 | $373,150 | $109,970 | $263,180 |
| 2022 | $3,266 | $309,260 | $90,880 | $218,380 |
| 2021 | $2,976 | $267,580 | $67,180 | $200,400 |
| 2020 | $2,781 | $252,790 | $63,400 | $189,390 |
| 2019 | $2,593 | $227,920 | $57,250 | $170,670 |
| 2018 | $2,774 | $189,350 | $47,310 | $142,040 |
| 2017 | $2,465 | $189,350 | $47,310 | $142,040 |
| 2016 | $2,393 | $169,970 | $42,240 | $127,730 |
| 2015 | $1,951 | $143,650 | $46,790 | $96,860 |
| 2014 | -- | $137,350 | $46,790 | $90,560 |
| 2013 | -- | $137,350 | $46,790 | $90,560 |
Source: Public Records
Map
Nearby Homes
- 241 NE Watson Ct
- 965 NE Milton Ct
- 8811 Overlook Circle Dr NE Unit 71
- 9406 Saint Johns Place NE
- 481 NE Waaga Way
- 679 NE Conifer Dr
- 8537 Washington 303
- 250 NE Silver Pine Dr
- 305 NE Waaga Way
- 8760 Washington 303 Unit L
- 10155 Royal Valley Rd NE
- 8640 Washington 303
- 7701 Beacon Place NE Unit B103
- 7761 Beacon Place NE Unit G-107
- 7761 Beacon Place NE Unit 103
- 7529 Bridge Place NE
- 8259 Kaster Dr NE
- 563 NW Silver Glen Ln
- 1995 Sipes Ln NE
- 7545 Old Military Rd NE
- 8690 Karolena Place NE
- 8710 Karolena Place NE
- 833 NE Sleepy Way
- 39 Cantershire Ave NE
- 8 Cantershire Ave NE
- 2 Cantershire Ave NE
- 1 Cantershire Ave NE
- 900 Cantershire Ave NE
- 900 Cantershire Ave NE
- 8720 Karolena Place NE
- 8705 Karolena Place NE
- 8695 Karolena Place NE
- 8680 Karolena Place NE
- 8685 Karolena Place NE
- 8613 Foster Grove Ct NE
- 8709 Karolena Place NE
- 8719 Karolena Place NE
- 8619 Foster Grove Ct NE
- 8675 Karolena Place NE
- 8670 Karolena Place NE