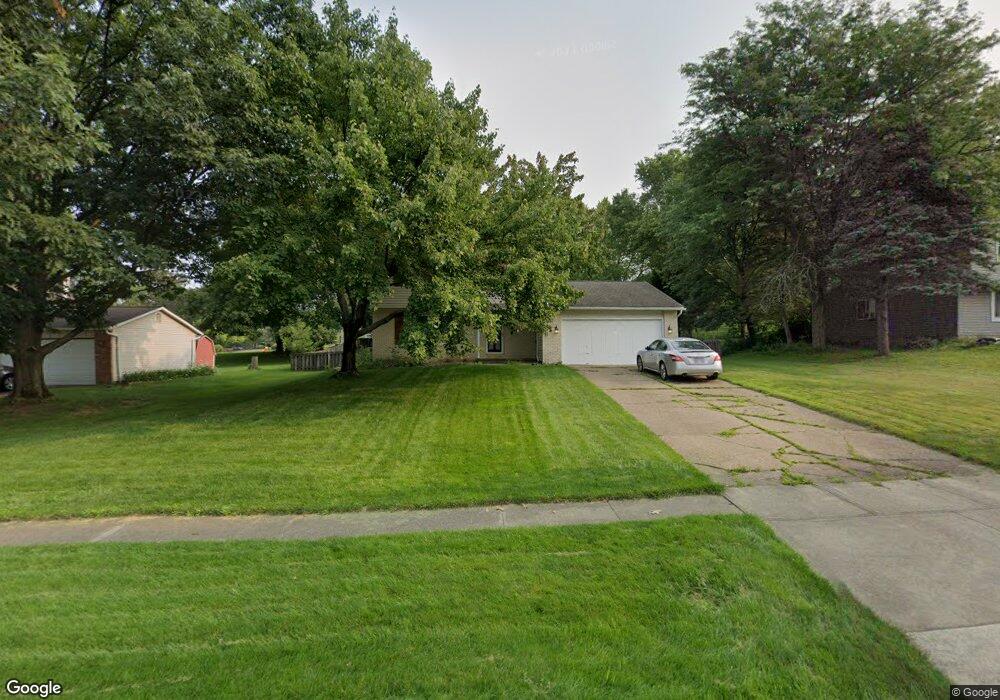
8700 N Gateway Dr North Royalton, OH 44133
Estimated Value: $314,083 - $376,000
3
Beds
2
Baths
1,700
Sq Ft
$201/Sq Ft
Est. Value
About This Home
This home is located at 8700 N Gateway Dr, North Royalton, OH 44133 and is currently estimated at $342,271, approximately $201 per square foot. 8700 N Gateway Dr is a home located in Cuyahoga County with nearby schools including North Royalton Middle School, North Royalton High School, and Royal Redeemer Lutheran School.
Ownership History
Date
Name
Owned For
Owner Type
Purchase Details
Closed on
Jul 17, 2000
Sold by
Nocera Jane A
Bought by
Sandhu Waryam S and Sandhu Charanjit
Current Estimated Value
Home Financials for this Owner
Home Financials are based on the most recent Mortgage that was taken out on this home.
Original Mortgage
$114,700
Outstanding Balance
$40,345
Interest Rate
7.99%
Estimated Equity
$301,926
Purchase Details
Closed on
Apr 15, 1991
Sold by
Nocera Thomas A
Bought by
Nocera Jane A
Purchase Details
Closed on
May 27, 1988
Sold by
Hackett Erla M
Bought by
Nocera Thomas A
Purchase Details
Closed on
Jul 20, 1984
Sold by
Hackett Warren H
Bought by
Hackett Erla M
Purchase Details
Closed on
Oct 14, 1980
Sold by
Rivera Abraham and D M
Bought by
Hackett Warren H
Purchase Details
Closed on
Jan 1, 1978
Bought by
Rivera Abraham and D M
Create a Home Valuation Report for This Property
The Home Valuation Report is an in-depth analysis detailing your home's value as well as a comparison with similar homes in the area
Home Values in the Area
Average Home Value in this Area
Purchase History
| Date | Buyer | Sale Price | Title Company |
|---|---|---|---|
| Sandhu Waryam S | $135,000 | Quality Title Agency Inc | |
| Nocera Jane A | -- | -- | |
| Nocera Thomas A | $95,900 | -- | |
| Hackett Erla M | $15,500 | -- | |
| Hackett Warren H | $76,900 | -- | |
| Rivera Abraham | -- | -- |
Source: Public Records
Mortgage History
| Date | Status | Borrower | Loan Amount |
|---|---|---|---|
| Open | Sandhu Waryam S | $114,700 |
Source: Public Records
Tax History Compared to Growth
Tax History
| Year | Tax Paid | Tax Assessment Tax Assessment Total Assessment is a certain percentage of the fair market value that is determined by local assessors to be the total taxable value of land and additions on the property. | Land | Improvement |
|---|---|---|---|---|
| 2024 | $5,055 | $87,010 | $18,655 | $68,355 |
| 2023 | $4,449 | $70,250 | $14,320 | $55,930 |
| 2022 | $4,419 | $70,250 | $14,320 | $55,930 |
| 2021 | $4,466 | $70,250 | $14,320 | $55,930 |
| 2020 | $4,157 | $62,160 | $12,670 | $49,490 |
| 2019 | $4,036 | $177,600 | $36,200 | $141,400 |
| 2018 | $4,079 | $62,160 | $12,670 | $49,490 |
| 2017 | $3,786 | $55,100 | $12,360 | $42,740 |
| 2016 | $3,548 | $55,100 | $12,360 | $42,740 |
| 2015 | $3,575 | $55,100 | $12,360 | $42,740 |
| 2014 | $3,575 | $55,100 | $12,360 | $42,740 |
Source: Public Records
Map
Nearby Homes
- 8381 N Akins Rd Unit H7
- 13831 Woodcroft Trace
- 7400 Akins Rd
- S/L Margaret Dr
- 12906 Cartwright Pkwy
- 13000 Cartwright Pkwy
- 7554 Margaret Dr
- 7595 Margaret Dr
- 7545 Margaret Dr
- 7585 Margaret Dr
- 7575 Margaret Dr
- 7535 Margaret Dr
- 7555 Margaret Dr
- 7600 Margaret Dr
- 7564 Margaret Dr
- 7574 Margaret Dr
- 12701 Gordon St
- 9447 Lindberg Dr
- 9035 Wallings Rd
- 5299 Whistler Ct
- 8734 N Gateway Dr
- 8666 N Gateway Dr
- 8766 N Gateway Dr
- 8634 N Gateway Dr
- 8291 Royalton Rd
- 8701 N Gateway Dr
- 8165 Royalton Rd
- 8733 N Gateway Dr
- 8277 Royalton Rd
- 8635 N Gateway Dr
- 8798 N Gateway Dr
- 8337 Royalton Rd
- 8767 N Gateway Dr
- 8600 N Gateway Dr
- 8583 Royalton Rd
- 8583 Royalton Rd
- 8261 Royalton Rd
- 8702 Center Dr
- 8365 Royalton Rd
- 8668 Center Dr