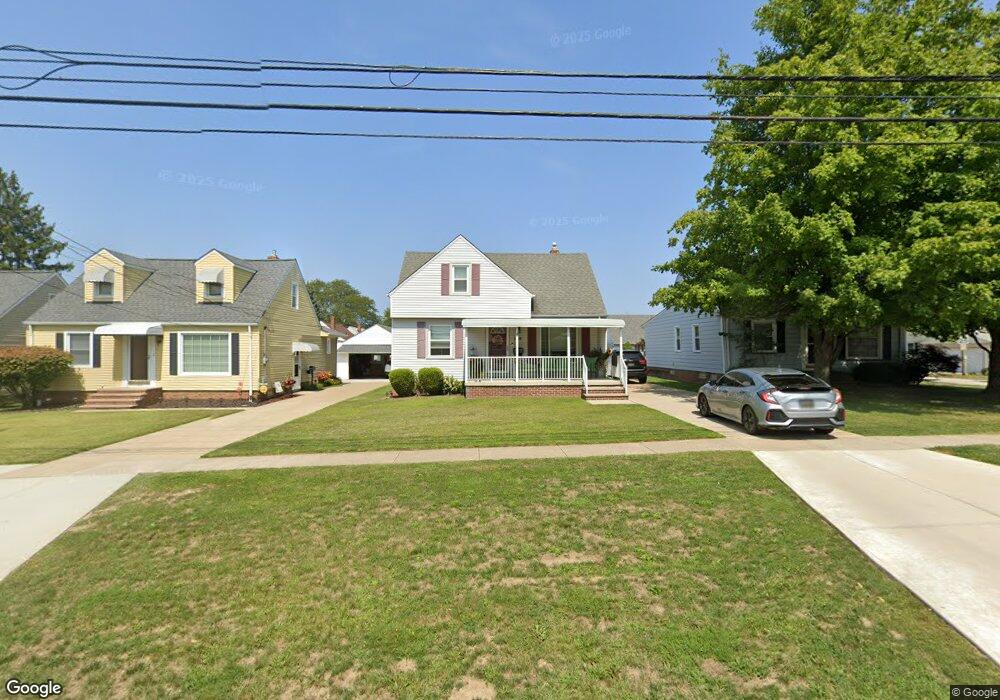
8706 Biddulph Rd Cleveland, OH 44144
Estimated Value: $178,713 - $219,000
3
Beds
1
Bath
1,257
Sq Ft
$164/Sq Ft
Est. Value
About This Home
This home is located at 8706 Biddulph Rd, Cleveland, OH 44144 and is currently estimated at $205,928, approximately $163 per square foot. 8706 Biddulph Rd is a home located in Cuyahoga County with nearby schools including Brooklyn Elementary School, Brooklyn High School, and Cleveland Preparatory Academy.
Ownership History
Date
Name
Owned For
Owner Type
Purchase Details
Closed on
Aug 11, 2004
Sold by
Causey James E and Causey Cheryl A
Bought by
Workman Hank E and Workman Tracey L
Current Estimated Value
Home Financials for this Owner
Home Financials are based on the most recent Mortgage that was taken out on this home.
Original Mortgage
$105,200
Outstanding Balance
$53,375
Interest Rate
6.35%
Mortgage Type
Purchase Money Mortgage
Estimated Equity
$152,553
Purchase Details
Closed on
Jun 20, 1988
Sold by
Chipka Richard S
Bought by
Causey Cheryl A
Purchase Details
Closed on
Mar 23, 1988
Sold by
Chipka Richard S Jr 1 and Chipka 6
Bought by
Chipka Richard S
Purchase Details
Closed on
Feb 8, 1988
Sold by
Fogliano Ignatius
Bought by
Foliano Thomas W
Purchase Details
Closed on
Jan 1, 1975
Bought by
Fogliano Ignatius
Create a Home Valuation Report for This Property
The Home Valuation Report is an in-depth analysis detailing your home's value as well as a comparison with similar homes in the area
Home Values in the Area
Average Home Value in this Area
Purchase History
| Date | Buyer | Sale Price | Title Company |
|---|---|---|---|
| Workman Hank E | $131,500 | Regency Title Agency | |
| Causey Cheryl A | $63,500 | -- | |
| Chipka Richard S | -- | -- | |
| Chipka Richard S Jr 1 | $48,000 | -- | |
| Foliano Thomas W | -- | -- | |
| Fogliano Ignatius | -- | -- |
Source: Public Records
Mortgage History
| Date | Status | Borrower | Loan Amount |
|---|---|---|---|
| Open | Workman Hank E | $105,200 | |
| Closed | Workman Hank E | $26,300 |
Source: Public Records
Tax History Compared to Growth
Tax History
| Year | Tax Paid | Tax Assessment Tax Assessment Total Assessment is a certain percentage of the fair market value that is determined by local assessors to be the total taxable value of land and additions on the property. | Land | Improvement |
|---|---|---|---|---|
| 2024 | $3,596 | $52,640 | $9,905 | $42,735 |
| 2023 | $3,018 | $40,850 | $8,190 | $32,660 |
| 2022 | $2,992 | $40,850 | $8,190 | $32,660 |
| 2021 | $3,042 | $40,850 | $8,190 | $32,660 |
| 2020 | $2,735 | $33,500 | $6,720 | $26,780 |
| 2019 | $2,682 | $95,700 | $19,200 | $76,500 |
| 2018 | $2,399 | $33,500 | $6,720 | $26,780 |
| 2017 | $2,362 | $30,140 | $6,060 | $24,080 |
| 2016 | $2,358 | $30,140 | $6,060 | $24,080 |
| 2015 | $2,372 | $30,140 | $6,060 | $24,080 |
| 2014 | $2,372 | $30,490 | $6,200 | $24,290 |
Source: Public Records
Map
Nearby Homes
- 4578 Forest Edge Dr
- 4722 Bentwood Dr
- 8906 Behrwald Ave
- 8913 Beech Ave
- 9005 Ansonia Ave
- 4728 Summer Ln
- 4451 Roadoan Rd
- 4444 Roadoan Rd
- 4830 Autumn Ln
- 9912 Richard Dr
- 9909 Richard Dr
- 9304 Torrance Ave
- 9416 Outlook Dr
- 9739 Memphis Villas Blvd
- 9756 Memphis Villas Blvd
- 4739 Ridge Rd
- 7420 Outlook Ave
- 4334 S Parkside Dr
- 10004 Manoa Ave
- 8998 Boxwood Cir
- 8802 Biddulph Rd
- 8702 Biddulph Rd
- 8820 Biddulph Rd
- 4588 Forest Edge Dr
- 4591 Bentwood Dr
- 8612 Biddulph Rd
- 4589 Bentwood Dr
- 8610 Biddulph Rd
- 4586 Forest Edge Dr
- 4587 Bentwood Dr
- 8606 Biddulph Rd
- 8900 Biddulph Rd
- 8705 Biddulph Rd
- 8801 Biddulph Rd
- 4591 Forest Edge Dr
- 8701 Biddulph Rd
- 4584 Forest Edge Dr
- 4585 Bentwood Dr
- 8604 Biddulph Rd
- 8819 Biddulph Rd