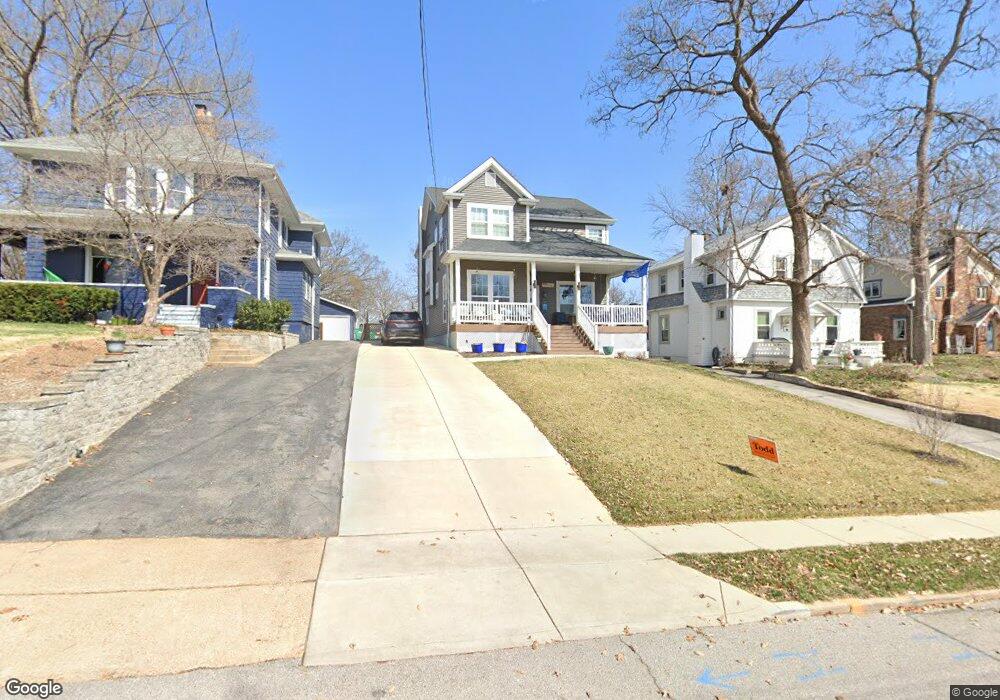
871 Atalanta Ave Saint Louis, MO 63119
Estimated Value: $178,000 - $910,651
1
Bed
1
Bath
857
Sq Ft
$798/Sq Ft
Est. Value
About This Home
This home is located at 871 Atalanta Ave, Saint Louis, MO 63119 and is currently estimated at $684,163, approximately $798 per square foot. 871 Atalanta Ave is a home located in St. Louis County with nearby schools including Avery Elementary School, Hixson Middle School, and Webster Groves High School.
Ownership History
Date
Name
Owned For
Owner Type
Purchase Details
Closed on
Dec 21, 2021
Sold by
Dyquem 913 Llc
Bought by
Moody Daniel B and Moody Lindsay R
Current Estimated Value
Home Financials for this Owner
Home Financials are based on the most recent Mortgage that was taken out on this home.
Original Mortgage
$548,250
Outstanding Balance
$504,246
Interest Rate
3.11%
Mortgage Type
New Conventional
Estimated Equity
$179,917
Purchase Details
Closed on
Aug 31, 2020
Sold by
Svoboda Joel
Bought by
Dyquem 913 Llc
Home Financials for this Owner
Home Financials are based on the most recent Mortgage that was taken out on this home.
Original Mortgage
$549,165
Interest Rate
2.9%
Mortgage Type
Construction
Purchase Details
Closed on
Apr 25, 2013
Sold by
Beneficial Financial I Inc
Bought by
Svoboda Joel
Purchase Details
Closed on
Nov 13, 2012
Sold by
Meyers Jay J and Meyers Mary E
Bought by
Beneficial Financial Inc
Create a Home Valuation Report for This Property
The Home Valuation Report is an in-depth analysis detailing your home's value as well as a comparison with similar homes in the area
Home Values in the Area
Average Home Value in this Area
Purchase History
| Date | Buyer | Sale Price | Title Company |
|---|---|---|---|
| Moody Daniel B | $729,172 | New Title Company Name | |
| Dyquem 913 Llc | $135,000 | Integrity Title Sln Llc | |
| Svoboda Joel | $76,500 | Us Title Main | |
| Beneficial Financial Inc | $76,057 | None Available |
Source: Public Records
Mortgage History
| Date | Status | Borrower | Loan Amount |
|---|---|---|---|
| Open | Moody Daniel B | $548,250 | |
| Previous Owner | Dyquem 913 Llc | $549,165 | |
| Closed | Moody Daniel B | $101,037 |
Source: Public Records
Tax History Compared to Growth
Tax History
| Year | Tax Paid | Tax Assessment Tax Assessment Total Assessment is a certain percentage of the fair market value that is determined by local assessors to be the total taxable value of land and additions on the property. | Land | Improvement |
|---|---|---|---|---|
| 2025 | $9,650 | $158,610 | $41,040 | $117,570 |
| 2024 | $9,650 | $139,270 | $29,850 | $109,420 |
| 2023 | $9,603 | $139,270 | $29,850 | $109,420 |
| 2022 | $8,696 | $117,080 | $29,850 | $87,230 |
| 2021 | $2,862 | $38,210 | $29,850 | $8,360 |
| 2020 | $2,836 | $35,270 | $29,850 | $5,420 |
| 2019 | $2,816 | $35,270 | $29,850 | $5,420 |
| 2018 | $2,738 | $30,440 | $20,900 | $9,540 |
| 2017 | $2,720 | $30,440 | $20,900 | $9,540 |
| 2016 | $2,602 | $27,900 | $17,920 | $9,980 |
| 2015 | $2,607 | $27,900 | $17,920 | $9,980 |
| 2014 | $2,728 | $28,420 | $12,670 | $15,750 |
Source: Public Records
Map
Nearby Homes
- 840 Marshall Ave
- 946 Marshall Ave Unit D
- 940 Brookside Ave
- 835 N Forest Ave
- 716 Clark Ave
- 808 Greeley Ave
- 544 Summit Ave
- 1048 Kuhlman Ln
- 1052 Kuhlman Ln
- 570 N Laclede Station Rd
- 1045 Tuxedo Blvd
- 1051 Kuhlman Ln
- 554 N Laclede Station Rd
- 619 N Bompart Ave
- 1088 Key Ave W
- 400 Marion Ave
- 610 Cornelia Ave
- 2855 Laclede Station Rd
- 7512 Suffolk Ave
- 4126 Exeter Ave
- 875 Atalanta Ave
- 869 Atalanta Ave
- 877 Atalanta Ave
- 859 Atalanta Ave
- 862 Marshall Ave
- 858 Marshall Ave
- 853 Atalanta Ave
- 870 Atalanta Ave
- 872 Atalanta Ave
- 868 Atalanta Ave
- 864 Atalanta Ave
- 876 Atalanta Ave
- 906 Yeatman Ave
- 852 Marshall Ave
- 910 Yeatman Ave
- 858 Atalanta Ave
- 849 Atalanta Ave
- 904 Yeatman Ave
- 852 Atalanta Ave
- 848 Marshall Ave