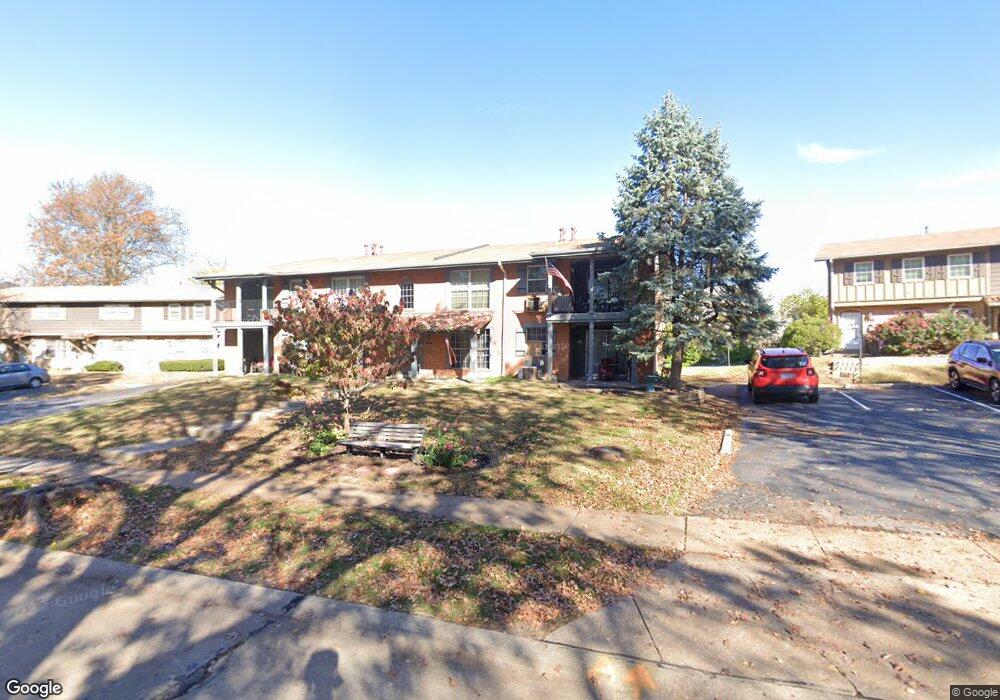
8717 Santa Bella Dr Unit E Hazelwood, MO 63042
Estimated Value: $36,000 - $48,000
1
Bed
1
Bath
649
Sq Ft
$65/Sq Ft
Est. Value
About This Home
This home is located at 8717 Santa Bella Dr Unit E, Hazelwood, MO 63042 and is currently estimated at $42,117, approximately $64 per square foot. 8717 Santa Bella Dr Unit E is a home located in St. Louis County with nearby schools including Armstrong Elementary School, West Middle School, and Hazelwood West High School.
Ownership History
Date
Name
Owned For
Owner Type
Purchase Details
Closed on
Oct 1, 2020
Sold by
Mark Rinne
Bought by
Rinne Teresa
Current Estimated Value
Home Financials for this Owner
Home Financials are based on the most recent Mortgage that was taken out on this home.
Original Mortgage
$35,432
Interest Rate
5.13%
Mortgage Type
Seller Take Back
Purchase Details
Closed on
Sep 29, 2020
Sold by
Teresa Rinne
Bought by
Hodges Christopher
Home Financials for this Owner
Home Financials are based on the most recent Mortgage that was taken out on this home.
Original Mortgage
$35,432
Interest Rate
5.13%
Mortgage Type
Seller Take Back
Purchase Details
Closed on
Oct 8, 2008
Sold by
Alexander Latrice
Bought by
Rinne Mark D and Rinne Teresa Marie
Purchase Details
Closed on
Aug 11, 2000
Sold by
Wheat Mark J and Wheat Esther
Bought by
Alexander Latrice
Home Financials for this Owner
Home Financials are based on the most recent Mortgage that was taken out on this home.
Original Mortgage
$24,300
Interest Rate
8.21%
Mortgage Type
VA
Create a Home Valuation Report for This Property
The Home Valuation Report is an in-depth analysis detailing your home's value as well as a comparison with similar homes in the area
Home Values in the Area
Average Home Value in this Area
Purchase History
| Date | Buyer | Sale Price | Title Company |
|---|---|---|---|
| Rinne Teresa | -- | -- | |
| Hodges Christopher | -- | -- | |
| Rinne Mark D | $25,000 | None Available | |
| Alexander Latrice | $24,300 | -- |
Source: Public Records
Mortgage History
| Date | Status | Borrower | Loan Amount |
|---|---|---|---|
| Previous Owner | Hodges Christopher | $35,432 | |
| Previous Owner | Alexander Latrice | $24,300 |
Source: Public Records
Tax History Compared to Growth
Tax History
| Year | Tax Paid | Tax Assessment Tax Assessment Total Assessment is a certain percentage of the fair market value that is determined by local assessors to be the total taxable value of land and additions on the property. | Land | Improvement |
|---|---|---|---|---|
| 2025 | $701 | $8,930 | $800 | $8,130 |
| 2024 | $701 | $8,640 | $550 | $8,090 |
| 2023 | $708 | $8,640 | $550 | $8,090 |
| 2022 | $610 | $6,650 | $930 | $5,720 |
| 2021 | $599 | $6,650 | $930 | $5,720 |
| 2020 | $569 | $5,910 | $1,050 | $4,860 |
| 2019 | $556 | $5,910 | $1,050 | $4,860 |
| 2018 | $538 | $5,300 | $610 | $4,690 |
| 2017 | $537 | $5,300 | $610 | $4,690 |
| 2016 | $561 | $5,470 | $610 | $4,860 |
| 2015 | $547 | $5,470 | $610 | $4,860 |
| 2014 | $443 | $4,410 | $840 | $3,570 |
Source: Public Records
Map
Nearby Homes
- 8740 Santa Bella Dr Unit C
- 7299 N Hanley Rd Unit B
- 8776 Santa Bella Dr Unit 90
- 8713 Nyflot Ave
- 7350 N Hanley Rd
- 8435 Bridle Spur Dr
- 7222 Hazelcrest Dr
- 8405 Rena Ct
- 7407 Sieloff Dr Unit F
- 7427 Sieloff Dr Unit A
- 7446 Sieloff Dr Unit H
- 7411 Hazelcrest Dr
- 8616 Elwyn Dr
- 7520 Hazelcrest Dr Unit 227
- 7497 Hazelcrest Dr Unit F
- 7463 Hazelcrest Dr
- 515 Marechal Ln
- 15 Henson Ln
- 200 Calbreath Ct
- 7040 Clover Ln
- 8717 Santa Bella Dr Unit A
- 8717 Santa Bella Dr Unit G
- 8717 Santa Bella Dr Unit F
- 8717 Santa Bella Dr Unit B
- 8717 Santa Bella Dr Unit H
- 8717 Santa Bella Dr Unit D
- 8717 Santa Bella Dr Unit C
- 8715 Santa Bella Dr Unit 169
- 8719 Santa Bella Dr
- 8713 Santa Bella Dr Unit 170
- 8721 Santa Bella Dr
- 8711 Santa Bella Dr
- 8723 Santa Bella Dr Unit 158
- 8709 Santa Bella Dr
- 8725 Santa Bella Dr
- 8707 Santa Bella Dr
- 8727 Santa Bella Dr
- 8744 Santa Bella Dr Unit E
- 8740 Santa Bella Dr Unit D
- 8744 Santa Bella Dr Unit A