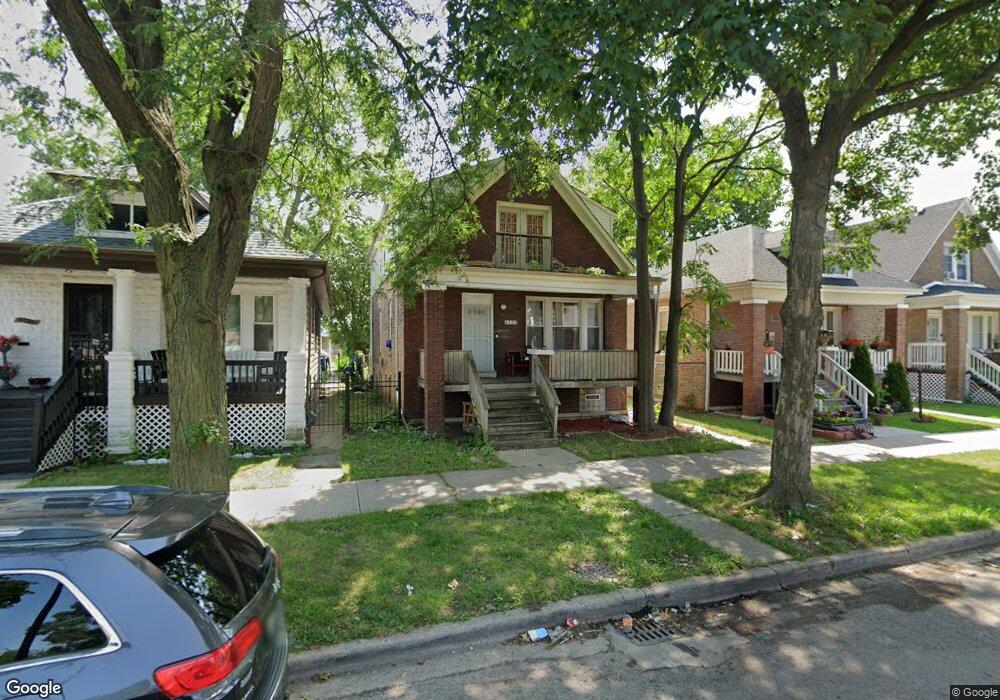
8729 S Morgan St Chicago, IL 60620
Auburn Gresham NeighborhoodEstimated Value: $118,000 - $205,000
3
Beds
2
Baths
4,216
Sq Ft
$42/Sq Ft
Est. Value
About This Home
This home is located at 8729 S Morgan St, Chicago, IL 60620 and is currently estimated at $175,732, approximately $41 per square foot. 8729 S Morgan St is a home located in Cook County with nearby schools including Mahalia Jackson Elementary School, Harlan Community Academy High School, and Hansberry College Prep.
Ownership History
Date
Name
Owned For
Owner Type
Purchase Details
Closed on
Feb 15, 2008
Sold by
Bank Of New York
Bought by
Green 7000 Properties Llc
Current Estimated Value
Purchase Details
Closed on
Mar 27, 2007
Sold by
Dillon
Bought by
Bank Of New York
Purchase Details
Closed on
Jan 27, 2006
Sold by
Carswell Demika C
Bought by
Dillon Bryant
Home Financials for this Owner
Home Financials are based on the most recent Mortgage that was taken out on this home.
Original Mortgage
$136,000
Interest Rate
8.45%
Mortgage Type
Fannie Mae Freddie Mac
Purchase Details
Closed on
Apr 19, 2002
Sold by
S I Boo Llc
Bought by
Carswell Demika C
Home Financials for this Owner
Home Financials are based on the most recent Mortgage that was taken out on this home.
Original Mortgage
$122,000
Interest Rate
10.2%
Purchase Details
Closed on
Jan 3, 2001
Sold by
Coleman Ronnie L
Bought by
S I Boo Llc
Create a Home Valuation Report for This Property
The Home Valuation Report is an in-depth analysis detailing your home's value as well as a comparison with similar homes in the area
Home Values in the Area
Average Home Value in this Area
Purchase History
| Date | Buyer | Sale Price | Title Company |
|---|---|---|---|
| Green 7000 Properties Llc | $73,000 | None Available | |
| Bank Of New York | -- | None Available | |
| Dillon Bryant | $170,000 | First American Title Ins Co | |
| Carswell Demika C | $121,000 | Law Title | |
| S I Boo Llc | -- | Chicago Title Insurance Co | |
| S I Boo Llc | $20,000 | Chicago Title Insurance Co |
Source: Public Records
Mortgage History
| Date | Status | Borrower | Loan Amount |
|---|---|---|---|
| Previous Owner | Dillon Bryant | $136,000 | |
| Previous Owner | Carswell Demika C | $122,000 |
Source: Public Records
Tax History Compared to Growth
Tax History
| Year | Tax Paid | Tax Assessment Tax Assessment Total Assessment is a certain percentage of the fair market value that is determined by local assessors to be the total taxable value of land and additions on the property. | Land | Improvement |
|---|---|---|---|---|
| 2024 | $1,269 | $12,000 | $4,005 | $7,995 |
| 2023 | $1,238 | $6,000 | $3,162 | $2,838 |
| 2022 | $1,238 | $6,000 | $3,162 | $2,838 |
| 2021 | $1,210 | $6,000 | $3,162 | $2,838 |
| 2020 | $2,270 | $10,165 | $3,162 | $7,003 |
| 2019 | $2,250 | $11,171 | $3,162 | $8,009 |
| 2018 | $2,212 | $11,171 | $3,162 | $8,009 |
| 2017 | $2,376 | $11,013 | $2,740 | $8,273 |
| 2016 | $2,211 | $11,013 | $2,740 | $8,273 |
| 2015 | $2,023 | $11,013 | $2,740 | $8,273 |
| 2014 | $1,984 | $10,668 | $2,529 | $8,139 |
| 2013 | $1,945 | $10,668 | $2,529 | $8,139 |
Source: Public Records
Map
Nearby Homes
- 8817 S Morgan St
- 8634 S Carpenter St
- 8607 S Morgan St
- 8836 S Carpenter St
- 8558 S Sangamon St
- 8636 S Aberdeen St
- 8546 S Sangamon St
- 8611 S Aberdeen St
- 1116 W 87th St Unit A
- 1146 W 88th St
- 738 W 87th St
- 8853 S Halsted St
- 8521 S Carpenter St
- 8548 S Aberdeen St
- 8513 S Sangamon St
- 8616 S Emerald Ave
- 8810 S Racine Ave
- 9002 S Morgan St
- 8922 S May St
- 9015 S Carpenter St
- 8731 S Morgan St
- 8725 S Morgan St
- 8735 S Morgan St
- 8721 S Morgan St
- 8719 S Morgan St
- 8717 S Morgan St
- 8728 S Sangamon St
- 8724 S Sangamon St
- 8732 S Sangamon St
- 8720 S Sangamon St
- 8736 S Sangamon St
- 8747 S Morgan St
- 8718 S Sangamon St
- 8740 S Sangamon St
- 8730 S Morgan St
- 8728 S Morgan St
- 8734 S Morgan St
- 8724 S Morgan St
- 8714 S Sangamon St
- 8742 S Sangamon St