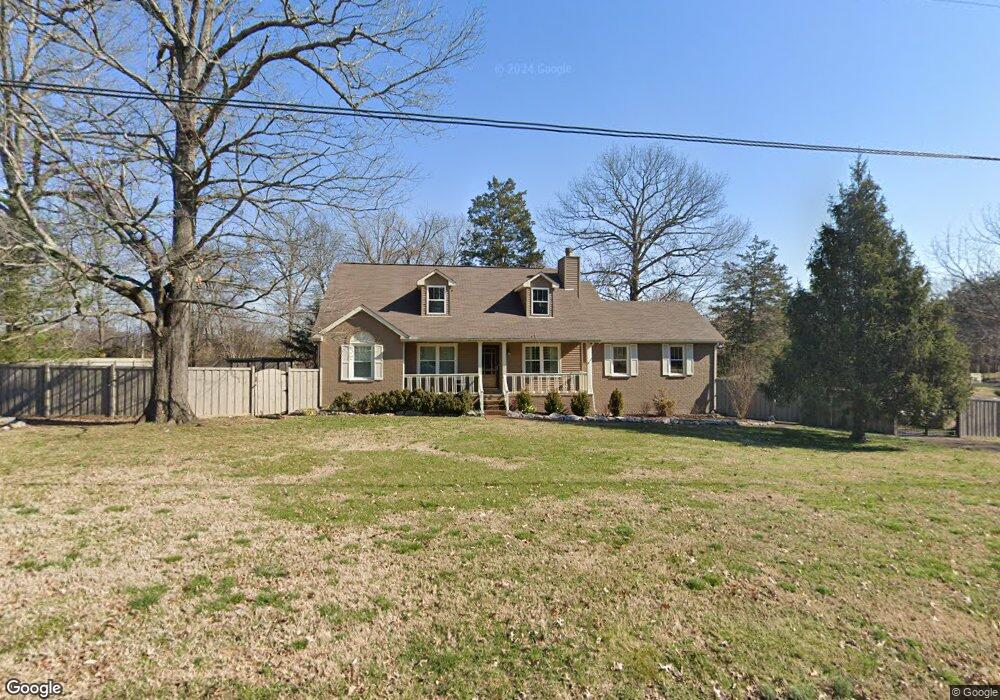
878 Stonebrook Blvd Nolensville, TN 37135
Estimated Value: $493,000 - $615,000
--
Bed
2
Baths
1,687
Sq Ft
$322/Sq Ft
Est. Value
About This Home
This home is located at 878 Stonebrook Blvd, Nolensville, TN 37135 and is currently estimated at $543,277, approximately $322 per square foot. 878 Stonebrook Blvd is a home located in Williamson County with nearby schools including Nolensville Elementary School, Mill Creek Middle School, and Nolensville High School.
Ownership History
Date
Name
Owned For
Owner Type
Purchase Details
Closed on
Aug 19, 2005
Sold by
Borders Sherrie L and Williams Sherrie L
Bought by
Richardson Terry B and Richardson Cynthia Lois
Current Estimated Value
Home Financials for this Owner
Home Financials are based on the most recent Mortgage that was taken out on this home.
Original Mortgage
$115,000
Interest Rate
5.61%
Mortgage Type
Fannie Mae Freddie Mac
Purchase Details
Closed on
Feb 22, 1999
Sold by
Todd Jones Eric and Beth Angela
Bought by
Borders Sherrie L
Home Financials for this Owner
Home Financials are based on the most recent Mortgage that was taken out on this home.
Original Mortgage
$144,500
Interest Rate
6.79%
Purchase Details
Closed on
Jul 5, 1996
Sold by
Cunningham Susan C
Bought by
Todd Jones Eric
Purchase Details
Closed on
Nov 10, 1995
Sold by
Light Thomas D
Bought by
Cunningham Susan C
Create a Home Valuation Report for This Property
The Home Valuation Report is an in-depth analysis detailing your home's value as well as a comparison with similar homes in the area
Home Values in the Area
Average Home Value in this Area
Purchase History
| Date | Buyer | Sale Price | Title Company |
|---|---|---|---|
| Richardson Terry B | $175,000 | Southern Land Title & Escrow | |
| Borders Sherrie L | $149,000 | -- | |
| Todd Jones Eric | $130,000 | -- | |
| Cunningham Susan C | $122,000 | -- |
Source: Public Records
Mortgage History
| Date | Status | Borrower | Loan Amount |
|---|---|---|---|
| Closed | Richardson Terry B | $115,000 | |
| Previous Owner | Borders Sherrie L | $144,500 |
Source: Public Records
Tax History Compared to Growth
Tax History
| Year | Tax Paid | Tax Assessment Tax Assessment Total Assessment is a certain percentage of the fair market value that is determined by local assessors to be the total taxable value of land and additions on the property. | Land | Improvement |
|---|---|---|---|---|
| 2025 | $1,813 | $133,425 | $47,500 | $85,925 |
| 2024 | $1,813 | $83,575 | $21,250 | $62,325 |
| 2023 | $1,813 | $83,575 | $21,250 | $62,325 |
| 2022 | $1,803 | $83,100 | $21,250 | $61,850 |
| 2021 | $1,803 | $83,100 | $21,250 | $61,850 |
| 2020 | $1,577 | $62,850 | $15,000 | $47,850 |
| 2019 | $1,489 | $62,850 | $15,000 | $47,850 |
| 2018 | $1,445 | $62,850 | $15,000 | $47,850 |
| 2017 | $1,433 | $62,850 | $15,000 | $47,850 |
| 2016 | $1,414 | $62,850 | $15,000 | $47,850 |
| 2015 | -- | $52,425 | $12,500 | $39,925 |
| 2014 | -- | $52,425 | $12,500 | $39,925 |
Source: Public Records
Map
Nearby Homes
- 625 Mer Rouge Dr
- 2248 Rolling Hills Dr
- 1115 Oak Creek Dr
- 373 Baronswood Dr
- 720 Stonecastle Place
- 2276 Rolling Hills Dr
- 607 Quarter Horse Ln
- 1228 Countryside Rd
- 0 Nolensville Rd Unit RTC2807764
- 0 Nolensville Rd Unit RTC2818506
- 0 Bostic Unit RTC2516475
- 0 Nolensville Rd Unit RTC3017763
- 825 Piccadilly Dr
- 829 Stonebrook Blvd
- 1016 Dortch Ln
- Ansley Plan at The Mill at McFarlin - Estates Series
- Kingston Plan at The Mill at McFarlin - Estates Series
- Weston Plan at The Mill at McFarlin - Estates Series
- Buchanan Plan at The Mill at McFarlin - Estates Series
- 3025 Ash Dale Ln
- 1306 Countryside Rd
- 1302 Countryside Rd
- 201 Norfolk Ln
- 874 Stonebrook Blvd
- 203 Norfolk Ln
- 879 Stonebrook Blvd
- 877 Stonebrook Blvd
- 1301 Countryside Rd
- 872 Stonebrook Blvd
- 205 Norfolk Ln
- 2200 Rolling Hills Dr
- 1295 Countryside Rd
- 1294 Countryside Rd
- 204 Norfolk Ln
- 2204 Rolling Hills Dr
- 207 Norfolk Ln
- 870 Stonebrook Blvd
- 1287 Countryside Rd
- 2201 Rolling Hills Dr
- 603 Limestone Ct