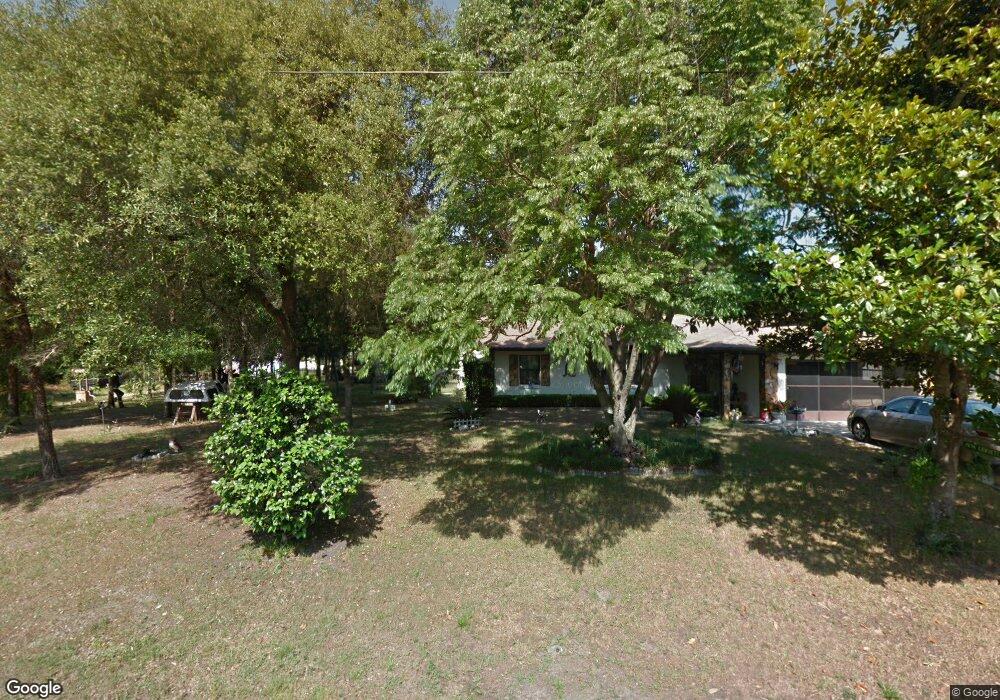
8786 N Amboy Dr Citrus Springs, FL 34433
Estimated Value: $209,000 - $265,000
2
Beds
2
Baths
1,548
Sq Ft
$161/Sq Ft
Est. Value
About This Home
This home is located at 8786 N Amboy Dr, Citrus Springs, FL 34433 and is currently estimated at $248,971, approximately $160 per square foot. 8786 N Amboy Dr is a home located in Citrus County with nearby schools including Citrus Springs Elementary School, Crystal River High School, and Crystal River Middle School.
Ownership History
Date
Name
Owned For
Owner Type
Purchase Details
Closed on
Dec 2, 2021
Sold by
Favreau Thomas C and Favreau Carolynn E
Bought by
Barker Rodney J and Barker Joanna
Current Estimated Value
Purchase Details
Closed on
Jun 18, 2014
Sold by
Morrison Tatiana V
Bought by
Favreau Carolynn E and Favreau Thomas C
Home Financials for this Owner
Home Financials are based on the most recent Mortgage that was taken out on this home.
Original Mortgage
$894,000
Interest Rate
4.28%
Mortgage Type
VA
Purchase Details
Closed on
Jan 31, 2008
Sold by
Morrison Peter R and Morrison Tatiana V
Bought by
Morrison Peter R and Morrison Tatiana V
Purchase Details
Closed on
Jan 1, 2008
Bought by
Favreau Carolynn E and Favreau Thomas C
Purchase Details
Closed on
Jan 11, 2001
Sold by
Coyne Francis X and Coyne Lenore R
Bought by
Morrison Peter R and Morrison Sharon A
Create a Home Valuation Report for This Property
The Home Valuation Report is an in-depth analysis detailing your home's value as well as a comparison with similar homes in the area
Home Values in the Area
Average Home Value in this Area
Purchase History
| Date | Buyer | Sale Price | Title Company |
|---|---|---|---|
| Barker Rodney J | $220,277 | Tropic Title Services | |
| Favreau Carolynn E | $89,400 | Wollinka Wikle Title Insuran | |
| Morrison Peter R | -- | Attorney | |
| Favreau Carolynn E | $100 | -- | |
| Morrison Peter R | $89,500 | Crystal River Title |
Source: Public Records
Mortgage History
| Date | Status | Borrower | Loan Amount |
|---|---|---|---|
| Previous Owner | Favreau Carolynn E | $894,000 |
Source: Public Records
Tax History Compared to Growth
Tax History
| Year | Tax Paid | Tax Assessment Tax Assessment Total Assessment is a certain percentage of the fair market value that is determined by local assessors to be the total taxable value of land and additions on the property. | Land | Improvement |
|---|---|---|---|---|
| 2024 | $2,099 | $175,825 | -- | -- |
| 2023 | $2,099 | $170,704 | $0 | $0 |
| 2022 | $2,030 | $165,732 | $9,980 | $155,752 |
| 2021 | $92 | $85,278 | $0 | $0 |
| 2020 | $813 | $123,887 | $5,620 | $118,267 |
| 2019 | $70 | $116,766 | $5,790 | $110,976 |
| 2018 | $70 | $93,374 | $5,220 | $88,154 |
| 2017 | $70 | $77,460 | $4,780 | $72,680 |
| 2016 | $70 | $75,867 | $10,510 | $65,357 |
| 2015 | $65 | $75,340 | $5,180 | $70,160 |
| 2014 | $714 | $74,350 | $3,774 | $70,576 |
Source: Public Records
Map
Nearby Homes
- 8921 N Tempest Dr
- 8859 N Amboy Dr
- 8862 N Spartan Dr
- 8891 N Amboy Dr
- 8790 N Elkcam Blvd
- 8867 N Trojan Dr
- 9001 N Elkcam Blvd
- 8242 N Elkcam Blvd
- 8260 N Elkcam Blvd
- 9239 N Elkcam Blvd
- 8603 N Tempest Dr
- 8550 N Trojan Dr
- 8951 N Amboy Dr
- 8967 N Amboy Dr
- 8596 N Spartan Dr
- 9055 N Amboy Dr
- 8797 N Vienna Dr
- 8929 N Elkcam Blvd
- 2981 W Challenge Ct
- 8564 N Spartan Dr
- 8798 N Amboy Dr
- 8812 N Amboy Dr
- 8777 N Tempest Dr
- 8815 N Tempest Dr
- 8831 N Tempest Dr
- 8765 N Tempest Dr
- 8781 N Amboy Dr
- 8842 N Amboy Dr
- 8752 N Amboy Dr
- 8843 N Tempest Dr
- 8814 N Tempest Dr
- 8751 N Amboy Dr
- 8860 N Amboy Dr
- 8828 Tempest
- 8828 N Tempest Dr
- 8734 N Amboy Dr
- 8840 N Tempest Dr
- 8875 N Tempest Dr
- 8801 N Spartan Dr