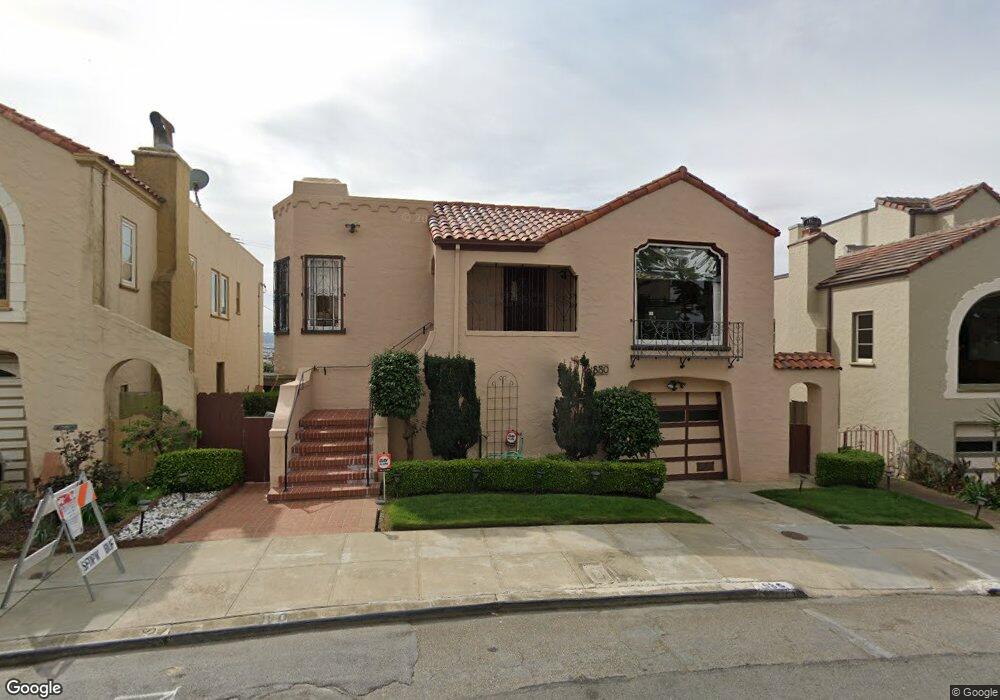
880 Darien Way San Francisco, CA 94127
Mount Davidson Manor NeighborhoodEstimated Value: $1,578,892 - $2,065,000
--
Bed
2
Baths
1,880
Sq Ft
$947/Sq Ft
Est. Value
About This Home
This home is located at 880 Darien Way, San Francisco, CA 94127 and is currently estimated at $1,780,973, approximately $947 per square foot. 880 Darien Way is a home located in San Francisco County with nearby schools including Commodore Sloat Elementary School, Aptos Middle School, and Stratford School.
Ownership History
Date
Name
Owned For
Owner Type
Purchase Details
Closed on
Feb 12, 2018
Sold by
Jaber Joyce S and Jaber Joyce Sarah
Bought by
Jaber Joyce Sarah and The Joyce Sarah Jaber Trust
Current Estimated Value
Home Financials for this Owner
Home Financials are based on the most recent Mortgage that was taken out on this home.
Original Mortgage
$453,101
Outstanding Balance
$386,866
Interest Rate
4.32%
Mortgage Type
New Conventional
Estimated Equity
$1,394,107
Purchase Details
Closed on
Jun 27, 2016
Sold by
Jaber Joyce S
Bought by
Jaber Joyce S and Joyce Sarah Jaber Trust
Purchase Details
Closed on
Oct 3, 2014
Sold by
Jaber Lamya F
Bought by
Jaber Joyce S
Purchase Details
Closed on
May 6, 2008
Sold by
Jaber Lamya F
Bought by
Jaber Lamya F and Lamya F Jaber 2008 Trust
Purchase Details
Closed on
May 1, 2008
Sold by
Jaber Joyce S
Bought by
Jaber Lamya F
Create a Home Valuation Report for This Property
The Home Valuation Report is an in-depth analysis detailing your home's value as well as a comparison with similar homes in the area
Home Values in the Area
Average Home Value in this Area
Purchase History
| Date | Buyer | Sale Price | Title Company |
|---|---|---|---|
| Jaber Joyce Sarah | -- | Servicelink | |
| Jaber Joyce S | -- | None Available | |
| Jaber Joyce S | -- | First American Title Co | |
| Jaber Lamya F | -- | First American Title Co | |
| Jaber Lamya F | -- | None Available | |
| Jaber Lamya F | -- | None Available |
Source: Public Records
Mortgage History
| Date | Status | Borrower | Loan Amount |
|---|---|---|---|
| Open | Jaber Joyce Sarah | $453,101 |
Source: Public Records
Tax History Compared to Growth
Tax History
| Year | Tax Paid | Tax Assessment Tax Assessment Total Assessment is a certain percentage of the fair market value that is determined by local assessors to be the total taxable value of land and additions on the property. | Land | Improvement |
|---|---|---|---|---|
| 2025 | $1,228 | $104,367 | $44,791 | $59,576 |
| 2024 | $1,228 | $102,321 | $43,913 | $58,408 |
| 2023 | $1,210 | $100,315 | $43,052 | $57,263 |
| 2022 | $1,189 | $98,349 | $42,208 | $56,141 |
| 2021 | $1,168 | $96,422 | $41,381 | $55,041 |
| 2020 | $1,811 | $95,434 | $40,957 | $54,477 |
| 2019 | $1,704 | $93,563 | $40,154 | $53,409 |
| 2018 | $1,646 | $91,729 | $39,367 | $52,362 |
| 2017 | $1,344 | $89,932 | $38,596 | $51,336 |
| 2016 | $1,356 | $88,170 | $37,840 | $50,330 |
| 2015 | $1,254 | $86,846 | $37,272 | $49,574 |
| 2014 | $997 | $85,145 | $36,542 | $48,603 |
Source: Public Records
Map
Nearby Homes
- 55 Upland Dr
- 950 Darien Way
- 150 Upland Dr
- 850 Darien Way
- 185 Upland Dr
- 760 Darien Way
- 611 Miramar Ave
- 245 Westgate Dr
- 2 Westgate Dr
- 54 Eastwood Dr
- 52-54 Eastwood Dr
- 75 San Jacinto Way
- 1475 Monterey Blvd
- 337 Jules Ave
- 154 Maywood Dr
- 275 Miramar Ave
- 271 Granada Ave
- 345 Moncada Way
- 72 Cresta Vista Dr
- 324 Holloway Ave