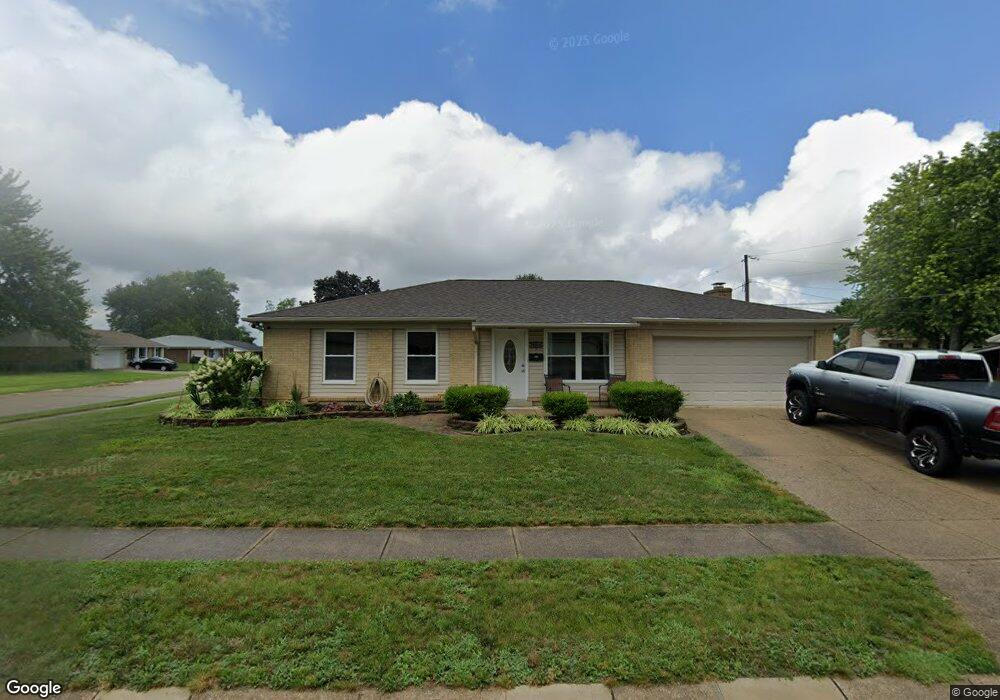
881 Cherry Blossom Dr Dayton, OH 45449
Estimated Value: $211,000 - $244,000
3
Beds
2
Baths
1,416
Sq Ft
$162/Sq Ft
Est. Value
About This Home
This home is located at 881 Cherry Blossom Dr, Dayton, OH 45449 and is currently estimated at $229,626, approximately $162 per square foot. 881 Cherry Blossom Dr is a home located in Montgomery County with nearby schools including West Carrollton High School and Bethel Baptist School.
Ownership History
Date
Name
Owned For
Owner Type
Purchase Details
Closed on
May 31, 2019
Sold by
Ringler Crystal G
Bought by
Sweeney Bryan L
Current Estimated Value
Home Financials for this Owner
Home Financials are based on the most recent Mortgage that was taken out on this home.
Original Mortgage
$106,583
Outstanding Balance
$93,901
Interest Rate
4.2%
Mortgage Type
FHA
Estimated Equity
$135,725
Purchase Details
Closed on
Jan 21, 2011
Sold by
Collins Donald and Collins Lucinda J
Bought by
Collins Donald and Collins Lucinda J
Purchase Details
Closed on
Jul 27, 2006
Sold by
Shatto Shirley
Bought by
Collins Donald and Collins Lucinda J
Home Financials for this Owner
Home Financials are based on the most recent Mortgage that was taken out on this home.
Original Mortgage
$98,400
Interest Rate
10.12%
Mortgage Type
Purchase Money Mortgage
Purchase Details
Closed on
Dec 13, 2005
Sold by
Hud
Bought by
Shatto Shirley
Purchase Details
Closed on
Mar 31, 1997
Sold by
Taylor Gene A and Taylor Nancy L
Bought by
Stevenart David J
Create a Home Valuation Report for This Property
The Home Valuation Report is an in-depth analysis detailing your home's value as well as a comparison with similar homes in the area
Home Values in the Area
Average Home Value in this Area
Purchase History
| Date | Buyer | Sale Price | Title Company |
|---|---|---|---|
| Sweeney Bryan L | $62,500 | Hallmark Title | |
| Collins Donald | -- | Attorney | |
| Collins Donald | $123,000 | None Available | |
| Shatto Shirley | $86,621 | Lakeside Title & Escrow Agen | |
| Stevenart David J | $96,500 | -- |
Source: Public Records
Mortgage History
| Date | Status | Borrower | Loan Amount |
|---|---|---|---|
| Open | Sweeney Bryan L | $106,583 | |
| Previous Owner | Collins Donald | $98,400 |
Source: Public Records
Tax History Compared to Growth
Tax History
| Year | Tax Paid | Tax Assessment Tax Assessment Total Assessment is a certain percentage of the fair market value that is determined by local assessors to be the total taxable value of land and additions on the property. | Land | Improvement |
|---|---|---|---|---|
| 2024 | $3,911 | $60,470 | $8,300 | $52,170 |
| 2023 | $3,911 | $60,470 | $8,300 | $52,170 |
| 2022 | $3,323 | $42,290 | $5,810 | $36,480 |
| 2021 | $3,329 | $42,290 | $5,810 | $36,480 |
| 2020 | $3,328 | $42,290 | $5,810 | $36,480 |
| 2019 | $3,286 | $38,550 | $5,050 | $33,500 |
| 2018 | $2,340 | $38,550 | $5,050 | $33,500 |
| 2017 | $2,323 | $38,550 | $5,050 | $33,500 |
| 2016 | $2,078 | $34,680 | $5,050 | $29,630 |
| 2015 | $1,905 | $34,680 | $5,050 | $29,630 |
| 2014 | $1,905 | $34,680 | $5,050 | $29,630 |
| 2012 | -- | $38,090 | $9,700 | $28,390 |
Source: Public Records
Map
Nearby Homes
- 250 Grantwood Dr
- 758 Cransberry Dr
- 257 Ironwood Dr
- 624 Skyview Dr
- 860 Mardel Dr
- 00 Heincke Rd
- 1000 Skyview Dr
- 00 Graceland Dr
- 429 Wilson Park Dr
- 765 Heincke Rd
- 26 Southard Ln
- 201 S Smith St
- 1803 Cudgell Dr
- 1100 S Elm St
- 203 W Pease Ave Unit 205
- 2125 Sherwood Forest Dr
- 1109 Sundance Dr
- 21 W Main St
- 12 E Main St
- 275 Orchard Hill Dr
- 879 Cherry Blossom Dr
- 889 Cherry Blossom Dr
- 772 Arenel Dr
- 875 Cherry Blossom Dr
- 882 Cherry Blossom Dr
- 886 Cherry Blossom Dr
- 16 Celita Ct
- 11 Celita Ct
- 878 Cherry Blossom Dr
- 890 Cherry Blossom Dr
- 779 Arenel Dr
- 768 Arenel Dr
- 871 Cherry Blossom Dr
- 893 Cherry Blossom Dr
- 874 Cherry Blossom Dr
- 894 Cherry Blossom Dr
- 775 Arenel Dr
- 261 Grantwood Dr
- 265 Grantwood Dr
- 870 Cherry Blossom Dr