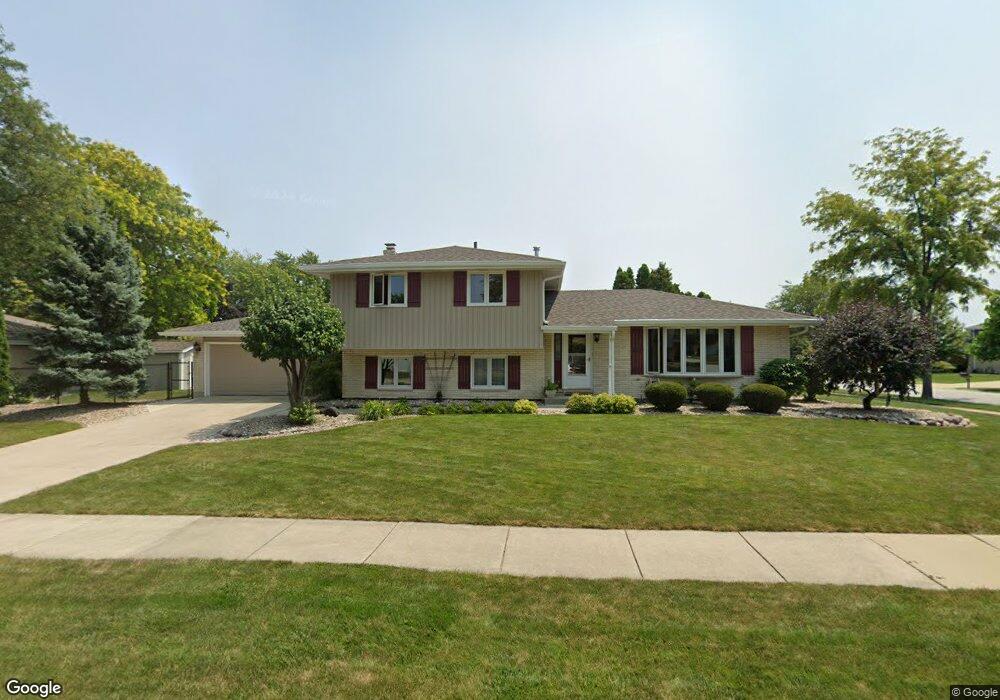
8817 Juniper Ct Tinley Park, IL 60487
Central Tinley Park NeighborhoodEstimated Value: $349,830 - $394,000
3
Beds
2
Baths
1,314
Sq Ft
$290/Sq Ft
Est. Value
About This Home
This home is located at 8817 Juniper Ct, Tinley Park, IL 60487 and is currently estimated at $380,708, approximately $289 per square foot. 8817 Juniper Ct is a home located in Cook County with nearby schools including Christa Mcauliffe School, Prairie View Middle School, and Victor J Andrew High School.
Ownership History
Date
Name
Owned For
Owner Type
Purchase Details
Closed on
May 4, 1995
Sold by
Crown Mtg Co
Bought by
Smith Christopher M and Smith Regina L
Current Estimated Value
Home Financials for this Owner
Home Financials are based on the most recent Mortgage that was taken out on this home.
Original Mortgage
$105,000
Interest Rate
8.43%
Purchase Details
Closed on
Nov 9, 1994
Sold by
Sheahan Michael F
Bought by
Crown Mtg Company
Create a Home Valuation Report for This Property
The Home Valuation Report is an in-depth analysis detailing your home's value as well as a comparison with similar homes in the area
Home Values in the Area
Average Home Value in this Area
Purchase History
| Date | Buyer | Sale Price | Title Company |
|---|---|---|---|
| Smith Christopher M | $150,000 | Enterprise Land Title Ltd | |
| Crown Mtg Company | -- | -- |
Source: Public Records
Mortgage History
| Date | Status | Borrower | Loan Amount |
|---|---|---|---|
| Closed | Smith Christopher M | $105,000 |
Source: Public Records
Tax History Compared to Growth
Tax History
| Year | Tax Paid | Tax Assessment Tax Assessment Total Assessment is a certain percentage of the fair market value that is determined by local assessors to be the total taxable value of land and additions on the property. | Land | Improvement |
|---|---|---|---|---|
| 2024 | $6,768 | $28,354 | $5,425 | $22,929 |
| 2023 | $5,657 | $30,000 | $5,425 | $24,575 |
| 2022 | $5,657 | $19,973 | $4,717 | $15,256 |
| 2021 | $5,512 | $19,972 | $4,717 | $15,255 |
| 2020 | $5,461 | $19,972 | $4,717 | $15,255 |
| 2019 | $5,613 | $21,422 | $4,245 | $17,177 |
| 2018 | $5,490 | $21,422 | $4,245 | $17,177 |
| 2017 | $5,366 | $21,422 | $4,245 | $17,177 |
| 2016 | $5,365 | $19,363 | $3,773 | $15,590 |
| 2015 | $5,254 | $19,363 | $3,773 | $15,590 |
| 2014 | $5,232 | $19,363 | $3,773 | $15,590 |
| 2013 | $5,036 | $20,055 | $3,773 | $16,282 |
Source: Public Records
Map
Nearby Homes
- 17324 Humber Ln
- 17230 Shetland Dr
- 8543 Carriage Ln
- Fremont Plan at Radcliffe Place
- Calysta Plan at Radcliffe Place
- Danbury Plan at Radcliffe Place
- Briarcliffe Plan at Radcliffe Place
- Eden Plan at Radcliffe Place
- Amberwood Plan at Radcliffe Place
- 8548 Bethany Ln
- 17631 Dover Ct
- 17533 Pecan Ln
- 17155 Kamp Ct Unit 9
- 8721 W 169th St
- 16950 90th Ave
- 9201 175th St
- 8456 170th Place
- 8750 W 169th St
- 16813 89th Ave
- 9260 Windsor Pkwy Unit 80
- 17307 Locust Ave
- 8803 Juniper Ct
- 8818 Juniper Ct
- 17313 Locust Ave
- 8829 Juniper Ct
- 8802 Juniper Ct
- 17306 Locust Ave
- 17259 Locust Ave
- 8814 Juniper Ct
- 8830 Juniper Ct
- 8808 Juniper Ct
- 17312 Locust Ave
- 17319 Locust Ave
- 17260 Locust Ave
- 8835 Juniper Ct
- 17249 Locust Ave
- 17325 Locust Ave
- 17318 Locust Ave
- 8743 Carriage Ln
- 8809 Sycamore Ct