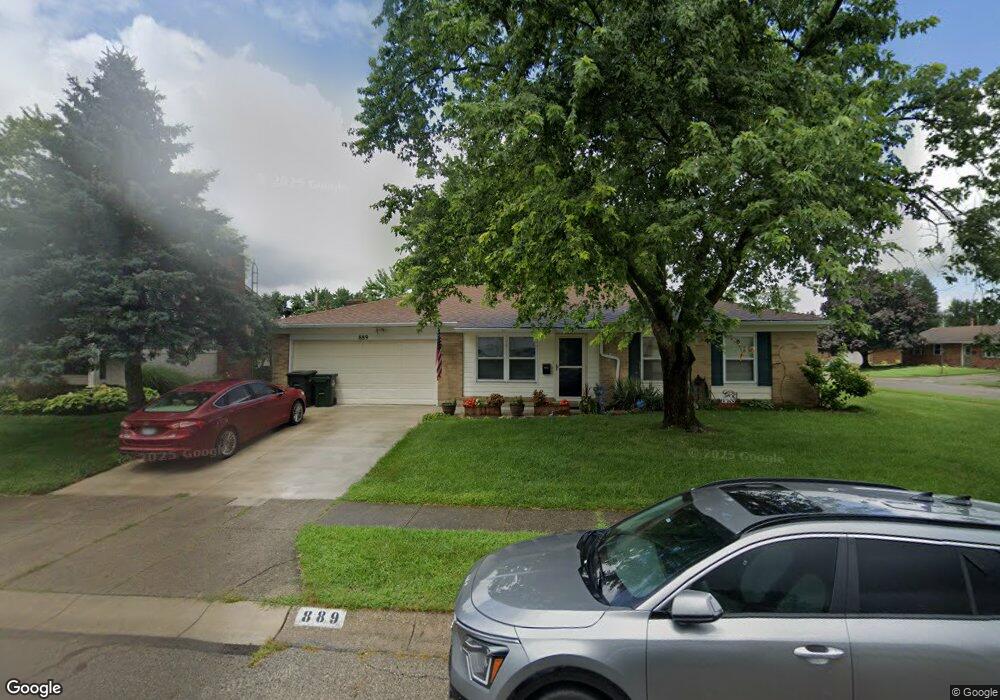
889 Cherry Blossom Dr Dayton, OH 45449
Estimated Value: $218,000 - $244,000
3
Beds
2
Baths
1,416
Sq Ft
$161/Sq Ft
Est. Value
About This Home
This home is located at 889 Cherry Blossom Dr, Dayton, OH 45449 and is currently estimated at $228,242, approximately $161 per square foot. 889 Cherry Blossom Dr is a home located in Montgomery County with nearby schools including West Carrollton High School and Bethel Baptist School.
Ownership History
Date
Name
Owned For
Owner Type
Purchase Details
Closed on
Jul 7, 2009
Sold by
Federal Home Loan Mortgage Corporation
Bought by
Marwick Deborah E
Current Estimated Value
Home Financials for this Owner
Home Financials are based on the most recent Mortgage that was taken out on this home.
Original Mortgage
$88,271
Outstanding Balance
$58,136
Interest Rate
5.49%
Mortgage Type
FHA
Estimated Equity
$170,106
Purchase Details
Closed on
May 26, 2009
Sold by
Hartley Zelda
Bought by
Federal Home Loan Mortgage Corp
Home Financials for this Owner
Home Financials are based on the most recent Mortgage that was taken out on this home.
Original Mortgage
$88,271
Outstanding Balance
$58,136
Interest Rate
5.49%
Mortgage Type
FHA
Estimated Equity
$170,106
Purchase Details
Closed on
Aug 23, 1999
Sold by
Clune Jeremy L and Clune Nicole L
Bought by
Hartley Zelda G
Home Financials for this Owner
Home Financials are based on the most recent Mortgage that was taken out on this home.
Original Mortgage
$85,560
Interest Rate
8.75%
Purchase Details
Closed on
Jun 24, 1997
Sold by
Mallett Belinda A
Bought by
Clune Jeremy L and Clune Nicole L
Create a Home Valuation Report for This Property
The Home Valuation Report is an in-depth analysis detailing your home's value as well as a comparison with similar homes in the area
Home Values in the Area
Average Home Value in this Area
Purchase History
| Date | Buyer | Sale Price | Title Company |
|---|---|---|---|
| Marwick Deborah E | $89,900 | None Available | |
| Federal Home Loan Mortgage Corp | $70,000 | None Available | |
| Hartley Zelda G | $107,500 | -- | |
| Clune Jeremy L | $99,900 | -- |
Source: Public Records
Mortgage History
| Date | Status | Borrower | Loan Amount |
|---|---|---|---|
| Open | Marwick Deborah E | $88,271 | |
| Previous Owner | Hartley Zelda G | $85,560 |
Source: Public Records
Tax History Compared to Growth
Tax History
| Year | Tax Paid | Tax Assessment Tax Assessment Total Assessment is a certain percentage of the fair market value that is determined by local assessors to be the total taxable value of land and additions on the property. | Land | Improvement |
|---|---|---|---|---|
| 2024 | $3,508 | $58,050 | $9,210 | $48,840 |
| 2023 | $3,508 | $58,050 | $9,210 | $48,840 |
| 2022 | $3,126 | $40,590 | $6,440 | $34,150 |
| 2021 | $3,132 | $40,590 | $6,440 | $34,150 |
| 2020 | $3,132 | $40,590 | $6,440 | $34,150 |
| 2019 | $3,136 | $37,590 | $5,600 | $31,990 |
| 2018 | $2,935 | $37,590 | $5,600 | $31,990 |
| 2017 | $2,914 | $37,590 | $5,600 | $31,990 |
| 2016 | $2,685 | $33,750 | $5,600 | $28,150 |
| 2015 | $2,464 | $33,750 | $5,600 | $28,150 |
| 2014 | $2,464 | $33,750 | $5,600 | $28,150 |
| 2012 | -- | $39,650 | $10,560 | $29,090 |
Source: Public Records
Map
Nearby Homes
- 758 Cransberry Dr
- 250 Grantwood Dr
- 257 Ironwood Dr
- 860 Mardel Dr
- 00 Heincke Rd
- 624 Skyview Dr
- 00 Graceland Dr
- 1000 Skyview Dr
- 765 Heincke Rd
- 429 Wilson Park Dr
- 26 Southard Ln
- 201 S Smith St
- 1803 Cudgell Dr
- 1109 Sundance Dr
- 203 W Pease Ave Unit 205
- 1100 S Elm St
- 2125 Sherwood Forest Dr
- 21 W Main St
- 12 E Main St
- 1026 Esther Ave
- 893 Cherry Blossom Dr
- 779 Arenel Dr
- 881 Cherry Blossom Dr
- 780 Cransberry Dr
- 775 Arenel Dr
- 774 Cransberry Dr
- 894 Cherry Blossom Dr
- 890 Cherry Blossom Dr
- 772 Arenel Dr
- 898 Cherry Blossom Dr
- 886 Cherry Blossom Dr
- 770 Cransberry Dr
- 879 Cherry Blossom Dr
- 771 Arenel Dr
- 768 Arenel Dr
- 882 Cherry Blossom Dr
- 792 Cransberry Dr
- 11 Celita Ct
- 764 Arenel Dr
- 273 Grantwood Dr