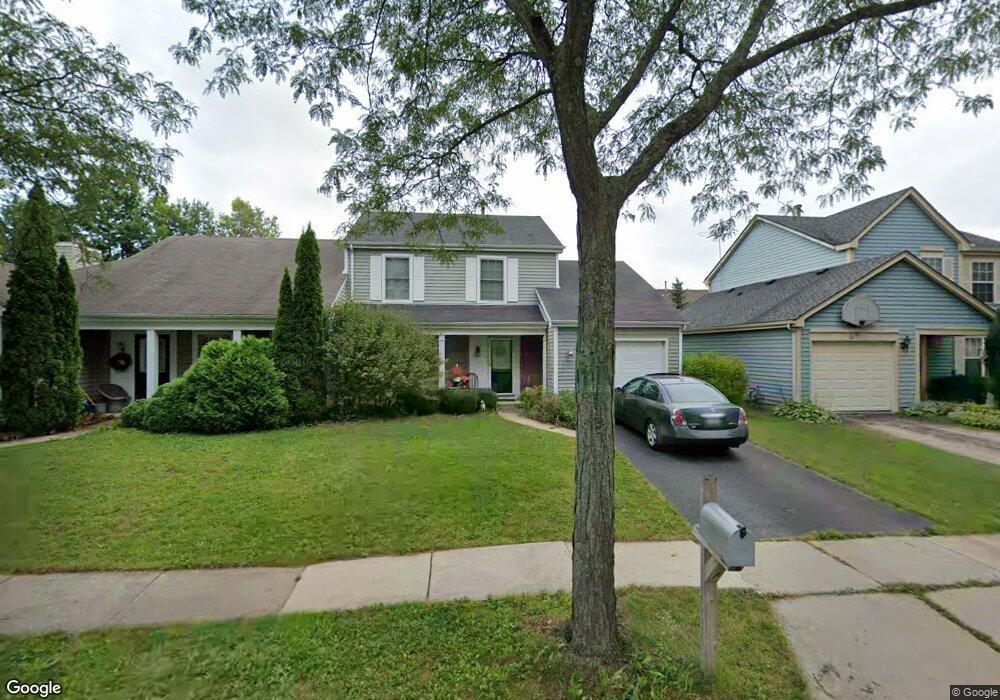
89 Bedford Rd Mundelein, IL 60060
Cambridge Chase NeighborhoodEstimated Value: $239,000 - $354,000
3
Beds
2
Baths
1,468
Sq Ft
$219/Sq Ft
Est. Value
About This Home
This home is located at 89 Bedford Rd, Mundelein, IL 60060 and is currently estimated at $322,177, approximately $219 per square foot. 89 Bedford Rd is a home located in Lake County with nearby schools including Hawthorn Elementary School North, Hawthorn School Of Dual Language, and Hawthorn Middle School North.
Ownership History
Date
Name
Owned For
Owner Type
Purchase Details
Closed on
Apr 26, 2021
Sold by
Carollo Gerald J and Carollo Allison
Bought by
Darden Trudy
Current Estimated Value
Home Financials for this Owner
Home Financials are based on the most recent Mortgage that was taken out on this home.
Original Mortgage
$220,924
Outstanding Balance
$199,487
Interest Rate
2.87%
Mortgage Type
FHA
Estimated Equity
$122,690
Purchase Details
Closed on
Mar 15, 2007
Sold by
Zhang Xu Feng and Luo Li Jie
Bought by
Carollo Gerald J and Carollo Allison
Home Financials for this Owner
Home Financials are based on the most recent Mortgage that was taken out on this home.
Original Mortgage
$188,700
Interest Rate
6.27%
Mortgage Type
Purchase Money Mortgage
Purchase Details
Closed on
Jan 9, 1995
Sold by
Guerriero William M
Bought by
Stone Richard L and Michel Lisa F
Home Financials for this Owner
Home Financials are based on the most recent Mortgage that was taken out on this home.
Original Mortgage
$118,500
Interest Rate
9.23%
Create a Home Valuation Report for This Property
The Home Valuation Report is an in-depth analysis detailing your home's value as well as a comparison with similar homes in the area
Home Values in the Area
Average Home Value in this Area
Purchase History
| Date | Buyer | Sale Price | Title Company |
|---|---|---|---|
| Darden Trudy | $225,000 | Gmt Title Agency | |
| Carollo Gerald J | $222,000 | 1St American Title | |
| Stone Richard L | $125,000 | -- |
Source: Public Records
Mortgage History
| Date | Status | Borrower | Loan Amount |
|---|---|---|---|
| Open | Darden Trudy | $220,924 | |
| Previous Owner | Carollo Gerald J | $188,700 | |
| Previous Owner | Stone Richard L | $118,500 |
Source: Public Records
Tax History Compared to Growth
Tax History
| Year | Tax Paid | Tax Assessment Tax Assessment Total Assessment is a certain percentage of the fair market value that is determined by local assessors to be the total taxable value of land and additions on the property. | Land | Improvement |
|---|---|---|---|---|
| 2024 | $7,515 | $88,857 | $20,896 | $67,961 |
| 2023 | $7,515 | $81,956 | $19,273 | $62,683 |
| 2022 | $6,964 | $74,366 | $18,526 | $55,840 |
| 2021 | $7,288 | $72,765 | $18,127 | $54,638 |
| 2020 | $6,696 | $67,491 | $16,813 | $50,678 |
| 2019 | $6,541 | $66,849 | $16,653 | $50,196 |
| 2018 | $6,233 | $64,239 | $15,746 | $48,493 |
| 2017 | $6,147 | $62,211 | $15,249 | $46,962 |
| 2016 | $5,906 | $58,984 | $14,458 | $44,526 |
| 2015 | $5,787 | $55,130 | $13,513 | $41,617 |
| 2014 | $5,916 | $50,130 | $11,412 | $38,718 |
| 2012 | $5,703 | $55,567 | $12,650 | $42,917 |
Source: Public Records
Map
Nearby Homes
- 1255 Huntington Dr
- 1726 Shoal Creek Terrace
- 1688 Saint Andrew Dr
- 31 Washington Blvd Unit 108
- 1290 Butterfield Rd
- 422 Shadow Creek Dr
- 1654 Pebble Beach Way
- 49 N Shaddle Ave
- 900 S Butterfield Rd
- 2245 Hazeltime Dr
- 640 Allanson Rd
- 701 Thomas Ct
- 215 Brice Ave
- 1969 Royal Birkdale Dr
- 841 Wilcox St
- 608 Sycamore St
- 510 S Hickory St
- 328 Brice Ave
- 433 E High St
- 18 S Hawthorne Blvd
- 85 Bedford Rd
- 93 Bedford Rd
- 97 Bedford Rd
- 81 Bedford Rd
- 83 Sandhurst Rd
- 79 Sandhurst Rd
- 87 Sandhurst Rd
- 101 Bedford Rd
- 77 Bedford Rd
- 75 Sandhurst Rd Unit 5
- 91 Sandhurst Rd
- 86 Bedford Rd
- 71 Sandhurst Rd
- 90 Bedford Rd
- 82 Bedford Rd
- 105 Bedford Rd
- 94 Bedford Rd
- 95 Sandhurst Rd
- 78 Bedford Rd
- 67 Sandhurst Rd