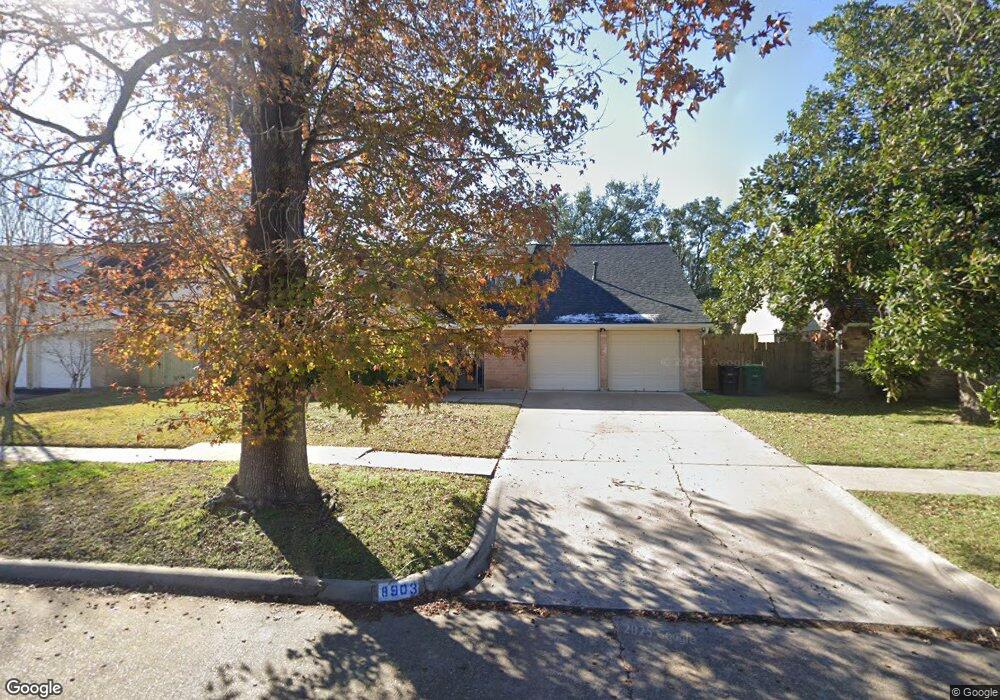
8903 Neff St Houston, TX 77036
Chinatown NeighborhoodEstimated Value: $323,000 - $381,000
4
Beds
3
Baths
2,616
Sq Ft
$134/Sq Ft
Est. Value
About This Home
This home is located at 8903 Neff St, Houston, TX 77036 and is currently estimated at $351,717, approximately $134 per square foot. 8903 Neff St is a home located in Harris County with nearby schools including Ed White Elementary School, Sugar Grove Academy, and Sharpstown High School.
Ownership History
Date
Name
Owned For
Owner Type
Purchase Details
Closed on
Feb 27, 2024
Sold by
Idris Zahra Mohammed Said
Bought by
Adem Sophia S
Current Estimated Value
Purchase Details
Closed on
Feb 26, 2024
Sold by
Adem Sophia S
Bought by
Idris Zahra Mohammed Sai
Purchase Details
Closed on
Nov 1, 1995
Sold by
Hermes Carol J
Bought by
Adem Mohammed
Home Financials for this Owner
Home Financials are based on the most recent Mortgage that was taken out on this home.
Original Mortgage
$81,200
Interest Rate
7.58%
Create a Home Valuation Report for This Property
The Home Valuation Report is an in-depth analysis detailing your home's value as well as a comparison with similar homes in the area
Home Values in the Area
Average Home Value in this Area
Purchase History
| Date | Buyer | Sale Price | Title Company |
|---|---|---|---|
| Adem Sophia S | -- | None Listed On Document | |
| Idris Zahra Mohammed Sai | -- | None Listed On Document | |
| Adem Mohammed | -- | Texas American Title Company |
Source: Public Records
Mortgage History
| Date | Status | Borrower | Loan Amount |
|---|---|---|---|
| Previous Owner | Adem Mohammed | $81,200 |
Source: Public Records
Tax History Compared to Growth
Tax History
| Year | Tax Paid | Tax Assessment Tax Assessment Total Assessment is a certain percentage of the fair market value that is determined by local assessors to be the total taxable value of land and additions on the property. | Land | Improvement |
|---|---|---|---|---|
| 2025 | $493 | $323,092 | $99,000 | $224,092 |
| 2024 | $493 | $321,372 | $99,000 | $222,372 |
| 2023 | $493 | $351,171 | $99,000 | $252,171 |
| 2022 | $6,351 | $280,513 | $57,750 | $222,763 |
| 2021 | $5,897 | $262,161 | $49,500 | $212,661 |
| 2020 | $5,755 | $230,035 | $49,500 | $180,535 |
| 2019 | $5,914 | $226,549 | $49,500 | $177,049 |
| 2018 | $4,000 | $211,429 | $49,500 | $161,929 |
| 2017 | $5,276 | $211,429 | $49,500 | $161,929 |
| 2016 | $4,797 | $211,429 | $49,500 | $161,929 |
| 2015 | $2,962 | $189,330 | $49,500 | $139,830 |
| 2014 | $2,962 | $166,589 | $49,500 | $117,089 |
Source: Public Records
Map
Nearby Homes
- 8826 Rowan Ln
- 8818 Roos Rd
- 9006 Roos Rd
- 7303 Augustine Dr
- 7302 Redding Rd
- 8530 Roos Rd
- 8527 Edgemoor Dr
- 9238 Stroud Dr
- 7302 Burning Tree Dr
- 8515 Edgemoor Dr
- 9223 Sandstone St
- 8923 Hendon Ln
- 9215 Sharpcrest St
- 8902 Langdon Ln
- 9201 Clarewood Dr Unit 203
- 9201 Clarewood Dr Unit 10
- 9201 Clarewood Dr Unit 204
- 8314 Edgemoor Dr
- 7939 Kendalia Dr
- 9506 Hendon Ln