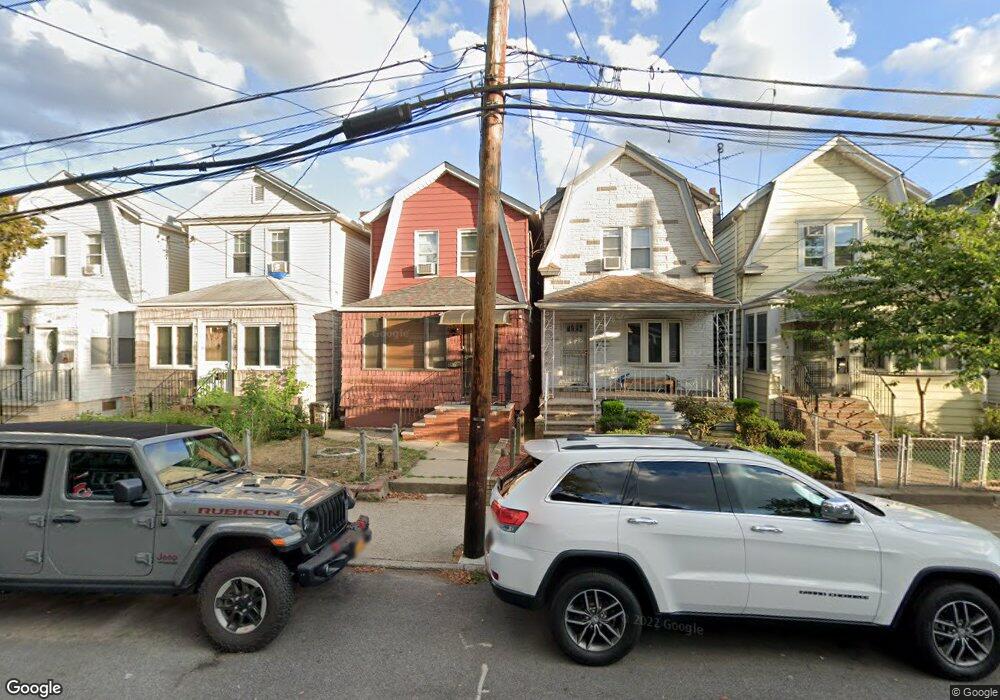
8908 89th Ave Woodhaven, NY 11421
Woodhaven NeighborhoodEstimated Value: $549,483 - $712,000
--
Bed
--
Bath
1,054
Sq Ft
$622/Sq Ft
Est. Value
About This Home
This home is located at 8908 89th Ave, Woodhaven, NY 11421 and is currently estimated at $655,871, approximately $622 per square foot. 8908 89th Ave is a home located in Queens County with nearby schools including P.S. 060 Woodhaven, Jhs 210 Elizabeth Blackwell, and St. Thomas the Apostle Catholic Academy.
Ownership History
Date
Name
Owned For
Owner Type
Purchase Details
Closed on
Apr 30, 2001
Sold by
Salcedo William and Giraldo Ruby
Bought by
Aubry Stephan P and Aubry Shao-Ling G
Current Estimated Value
Home Financials for this Owner
Home Financials are based on the most recent Mortgage that was taken out on this home.
Original Mortgage
$185,250
Outstanding Balance
$69,274
Interest Rate
7.05%
Estimated Equity
$586,597
Purchase Details
Closed on
Dec 27, 1996
Sold by
Dambeck John J and Dambeck Carol A
Bought by
Salcedo William and Giraldo Ruby
Home Financials for this Owner
Home Financials are based on the most recent Mortgage that was taken out on this home.
Original Mortgage
$143,150
Interest Rate
7.8%
Mortgage Type
FHA
Purchase Details
Closed on
Apr 1, 1996
Sold by
Dambeck John and Dambeck Carol
Bought by
Dambeck John and Dambeck Carol
Create a Home Valuation Report for This Property
The Home Valuation Report is an in-depth analysis detailing your home's value as well as a comparison with similar homes in the area
Home Values in the Area
Average Home Value in this Area
Purchase History
| Date | Buyer | Sale Price | Title Company |
|---|---|---|---|
| Aubry Stephan P | -- | -- | |
| Salcedo William | $142,000 | Fidelity National Title Ins | |
| Dambeck John | -- | Commonwealth Land Title Ins |
Source: Public Records
Mortgage History
| Date | Status | Borrower | Loan Amount |
|---|---|---|---|
| Open | Aubry Stephan P | $185,250 | |
| Previous Owner | Salcedo William | $143,150 |
Source: Public Records
Tax History Compared to Growth
Tax History
| Year | Tax Paid | Tax Assessment Tax Assessment Total Assessment is a certain percentage of the fair market value that is determined by local assessors to be the total taxable value of land and additions on the property. | Land | Improvement |
|---|---|---|---|---|
| 2025 | $4,225 | $23,783 | $7,035 | $16,748 |
| 2024 | $4,238 | $22,438 | $7,372 | $15,066 |
| 2023 | $3,970 | $21,168 | $6,212 | $14,956 |
| 2022 | $3,904 | $37,260 | $11,040 | $26,220 |
| 2021 | $4,122 | $35,880 | $11,040 | $24,840 |
| 2020 | $3,899 | $34,980 | $11,040 | $23,940 |
| 2019 | $3,619 | $32,280 | $11,040 | $21,240 |
| 2018 | $3,298 | $17,640 | $7,197 | $10,443 |
| 2017 | $3,267 | $17,496 | $7,720 | $9,776 |
| 2016 | $3,188 | $17,496 | $7,720 | $9,776 |
| 2015 | $1,771 | $16,516 | $9,823 | $6,693 |
| 2014 | $1,771 | $15,582 | $11,076 | $4,506 |
Source: Public Records
Map
Nearby Homes