NOT LISTED FOR SALE

8910 Central Ave Oak Lawn, IL 60453

Estimated Value: $158,819 - $250,000

1 Bed
1 Bath
598 Sq Ft
$327/Sq Ft Est. Value

Last Sold December 30, 2016

Last sale price $65,000 $109 Per Sq Ft

Est. 201% increase in value since last sale

Current estimated payment $1,132/month

About This Home

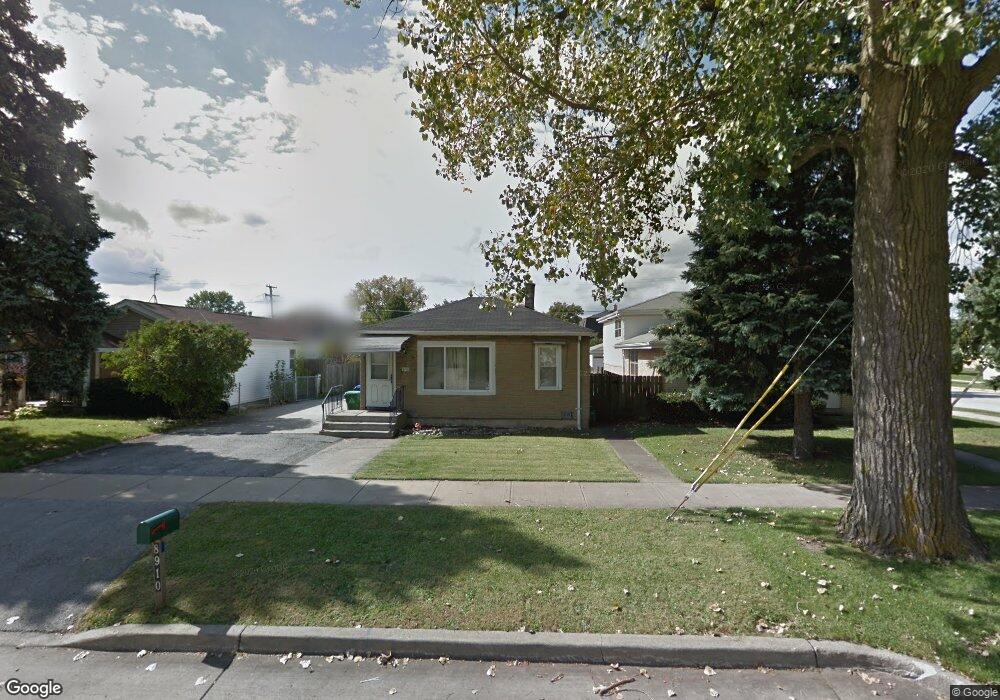
Beautiful Oak Lawn open concept Ranch! Property features wood laminate flooring, bright living room, eat in kitchen with plenty of cabinet space, spacious bedroom, full bath and nice size laundry room. Outdoor features large backyard with concrete patio and shed. Detached over-sized 1 car garage with plenty of space for additional storage. Property is close to schools, shopping, transportation and recreation! Subject to Short Sale Approval.

Ownership History

Date Name Owned For Owner Type

Purchase Details

Listed on
Sep 10, 2016
Closed on
Dec 30, 2016
Sold by
Shane Richard and Shane Lyndsey
Bought by
Ramahi Hafez
Seller's Agent
Mary Wallace
Coldwell Banker Realty
Buyer's Agent
Saadi Ramadan
New Vison Real Estate Brokers
List Price
$59,900
Sold Price
$65,000
Premium/Discount to List
$5,100
8.51%
Current Estimated Value
$195,455

Home Financials for this Owner

Home Financials are based on the most recent Mortgage that was taken out on this home.
Estimated Appreciation
$130,455
Avg. Annual Appreciation
13.28%
Source: Public Records

Range of Values:

Collateral Analytics

Collateral Analytics Collateral Analytics AVMs (Automated Valuation Model) employ a number of statistical approaches combined with neighborhood-specific comparable selection guarantees the most up-to-date and precise valuations.

Not Available

Collateral Analytics does not have data for the current month. Please view the chart for historical values.

ICE

ICE Mortgage Technology ICE Mortgage Technology’s AVM (Automated Valuation Model) is a state-of-the-art online residential property valuation tool that provides a quick and accurate estimate of the value of almost any home in the U.S.

Not Available

ICE Mortgage Technology does not have data for the current month. Please view the chart for historical values.

First American

First American First American Data & Analytics’ next-generation AVM combines unrivaled data assets with a blended ensemble of valuation models to produce highly accurate, reliable valuations you can trust.

Not Available

First American does not have data for the current month. Please view the chart for historical values.

Quantarium

Quantarium Quantarium’s valuation service, repeatedly proven the industry’s most accurate and comprehensive, is supercharged with a self-learning and auto-tuning AI engine that continually becomes smarter and more accurate as it processes daily inputs from the industry’s leading RE data lake.

Not Available

Quantarium does not have data for the current month. Please view the chart for historical values.

Average Value
Not Available
List Price
Sold Price
Create a Home Valuation Report for This Property
The Home Valuation Report is an in-depth analysis detailing your home's value as well as a comparison with similar homes in the area

Home Values in the Area

Source: Public Records

Average Home Value in this Area


Source: Public Records

Purchase History

Date Buyer Sale Price Title Company
Ramahi Hafez $65,000 Attorney
Source: Public Records

Property History

Date Event Price List to Sale Price per Sq Ft Prior Sale
12/30/2016 12/30/16 Sold $65,000 +8.5% $109 / Sq Ft View Prior Sale
09/17/2016 09/17/16 Pending -- -- --
09/10/2016 09/10/16 For Sale $59,900 -- $100 / Sq Ft

Tax History Compared to Growth

Source: Public Records

Tax History

Year Tax Paid Tax Assessment Tax Assessment Total Assessment is a certain percentage of the fair market value that is determined by local assessors to be the total taxable value of land and additions on the property. Land Improvement
2024 $1,310 $4,508 $2,284 $2,224
2023 $978 $4,508 $2,284 $2,224
2022 $978 $2,787 $1,969 $818
2021 $1,004 $2,949 $1,968 $981
2020 $983 $2,949 $1,968 $981
2019 $781 $3,092 $1,811 $1,281
2018 $748 $3,092 $1,811 $1,281
2017 $834 $3,318 $1,811 $1,507
2016 $807 $2,902 $1,496 $1,406
2015 $792 $2,902 $1,496 $1,406
2014 $789 $2,902 $1,496 $1,406
2013 $797 $3,177 $1,496 $1,681
Source: Public Records

Agents Affiliated with this Home

  • Section Image
  • Section Image
See All Agents

Map