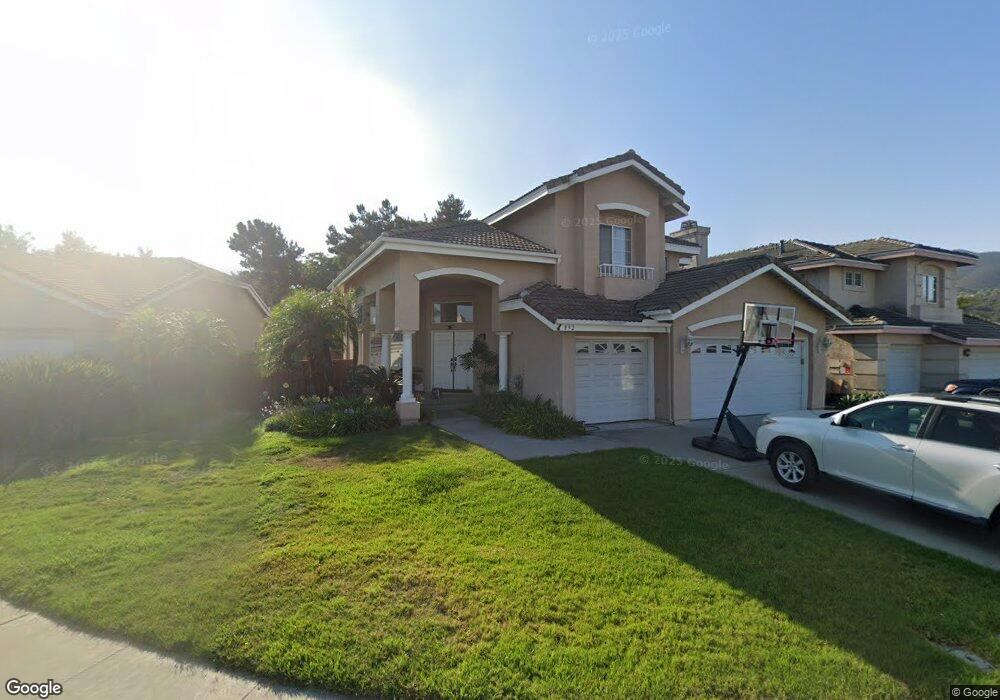
892 Overlook Cir San Marcos, CA 92078
Barham Discovery Community NeighborhoodEstimated Value: $1,086,390 - $1,479,000
4
Beds
3
Baths
2,118
Sq Ft
$579/Sq Ft
Est. Value
About This Home
This home is located at 892 Overlook Cir, San Marcos, CA 92078 and is currently estimated at $1,227,348, approximately $579 per square foot. 892 Overlook Cir is a home located in San Diego County with nearby schools including Discovery Elementary School, San Elijo Middle School, and San Marcos High School.
Ownership History
Date
Name
Owned For
Owner Type
Purchase Details
Closed on
Nov 24, 2021
Sold by
Meyerholtz Family Trust
Bought by
Meyerholtz Eric Michael and Meyerholtz Megan Grace
Current Estimated Value
Home Financials for this Owner
Home Financials are based on the most recent Mortgage that was taken out on this home.
Original Mortgage
$585,000
Interest Rate
3.11%
Mortgage Type
New Conventional
Purchase Details
Closed on
Aug 16, 2016
Sold by
Meyerholtz Thomas E and Meyerholtz Sherri L
Bought by
Meyerholtz Thomas E and Meyerholtz Sherri L
Purchase Details
Closed on
Sep 3, 1993
Sold by
The Presley Companies
Bought by
Meyerholtz Thomas E and Meyerholtz Sherri L
Home Financials for this Owner
Home Financials are based on the most recent Mortgage that was taken out on this home.
Original Mortgage
$160,900
Interest Rate
6.97%
Create a Home Valuation Report for This Property
The Home Valuation Report is an in-depth analysis detailing your home's value as well as a comparison with similar homes in the area
Home Values in the Area
Average Home Value in this Area
Purchase History
| Date | Buyer | Sale Price | Title Company |
|---|---|---|---|
| Meyerholtz Eric Michael | $775,000 | Chicago Title | |
| Meyerholtz Thomas E | -- | None Available | |
| Meyerholtz Thomas E | $211,000 | First American Title Co |
Source: Public Records
Mortgage History
| Date | Status | Borrower | Loan Amount |
|---|---|---|---|
| Previous Owner | Meyerholtz Eric Michael | $585,000 | |
| Previous Owner | Meyerholtz Thomas E | $160,900 |
Source: Public Records
Tax History Compared to Growth
Tax History
| Year | Tax Paid | Tax Assessment Tax Assessment Total Assessment is a certain percentage of the fair market value that is determined by local assessors to be the total taxable value of land and additions on the property. | Land | Improvement |
|---|---|---|---|---|
| 2025 | $9,351 | $842,436 | $530,604 | $311,832 |
| 2024 | $9,351 | $806,310 | $520,200 | $286,110 |
| 2023 | $9,182 | $337,921 | $80,067 | $257,854 |
| 2022 | $4,197 | $337,921 | $80,067 | $257,854 |
| 2021 | $4,129 | $331,297 | $78,498 | $252,799 |
| 2020 | $4,090 | $327,901 | $77,694 | $250,207 |
| 2019 | $4,006 | $321,472 | $76,171 | $245,301 |
| 2018 | $3,886 | $315,170 | $74,678 | $240,492 |
| 2017 | $3,812 | $308,991 | $73,214 | $235,777 |
| 2016 | $3,755 | $302,933 | $71,779 | $231,154 |
| 2015 | $4,410 | $298,383 | $70,701 | $227,682 |
| 2014 | $4,318 | $292,540 | $69,317 | $223,223 |
Source: Public Records
Map
Nearby Homes
- 650 #291 S Rancho Santa fe Rd
- 797 Trailside Place
- 597 Middlebrook Rd
- 550 Echo Ln
- 380 Avenida la Cuesta
- 1027 Cima Dr
- 1048 Via Vera Cruz
- 694 Metric Rd
- 653 Fahrenheit Rd
- 1324 Vista Colina Dr
- Radius 2 Plan at The Hill District - Radius
- Radius 3 Plan at The Hill District - Radius
- Element 2 Plan at The Hill District - Element
- Element 1 Plan at The Hill District - Element
- Apex 4 Plan at The Hill District - Apex
- 501 Gadget Way
- Apex 2X Plan at The Hill District - Apex
- Plan 4 at The Hill District - Peak59
- Plan 1 at The Hill District - Peak59
- Radius 4 Plan at The Hill District - Radius
- 896 Overlook Cir
- 886 Overlook Cir Unit 3
- 880 Overlook Cir
- 875 Overlook Cir
- 874 Overlook Cir Unit 3
- 891 Overlook Cir
- 883 Overlook Cir Unit 3
- 647 Poppy Rd
- 653 Poppy Rd
- 868 Overlook Cir
- 639 Poppy Rd
- 659 Poppy Rd
- 862 Overlook Cir Unit 3
- 869 Overlook Cir Unit 3
- 674 Poppy Rd
- 916 Mendocino Ct
- 912 Mendocino Ct
- 667 Poppy Rd
- 856 Overlook Cir
- 652 Larkspur Ct