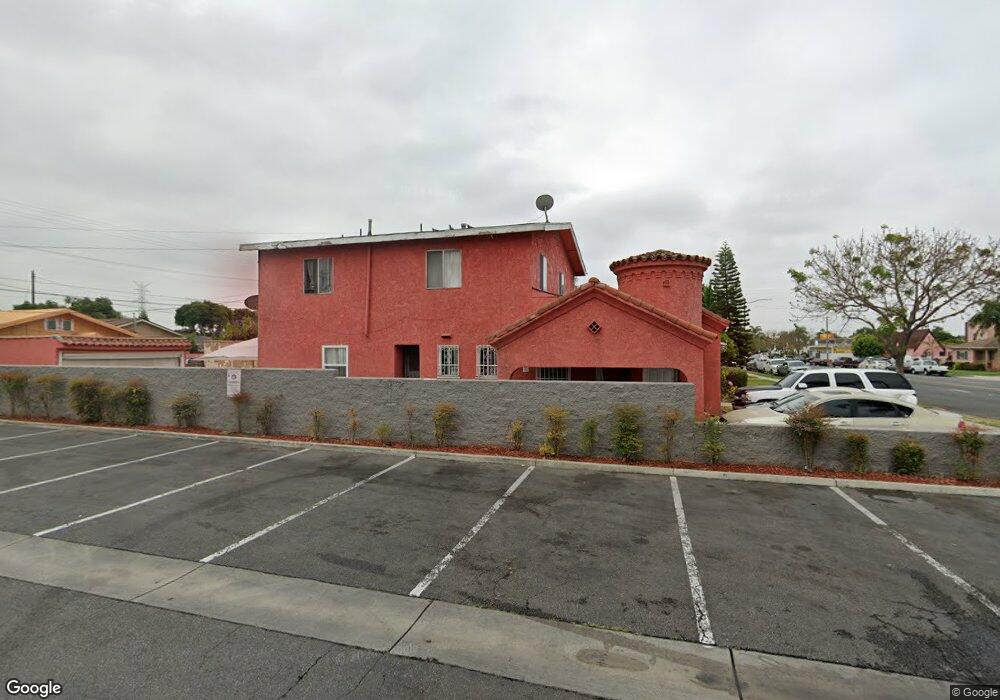
8924 California Ave South Gate, CA 90280
Estimated Value: $669,000 - $784,358
4
Beds
2
Baths
2,162
Sq Ft
$336/Sq Ft
Est. Value
About This Home
This home is located at 8924 California Ave, South Gate, CA 90280 and is currently estimated at $726,840, approximately $336 per square foot. 8924 California Ave is a home located in Los Angeles County with nearby schools including Independence Elementary School, South Gate Middle School, and Southeast Middle School.
Ownership History
Date
Name
Owned For
Owner Type
Purchase Details
Closed on
Feb 4, 2019
Sold by
Solis Carmen
Bought by
Solis Carmen and The Carmen Solis 2019 Revocabl
Current Estimated Value
Purchase Details
Closed on
Mar 7, 2005
Sold by
Sanchez Luis and Solis Carmen
Bought by
Sanchez Luis
Home Financials for this Owner
Home Financials are based on the most recent Mortgage that was taken out on this home.
Original Mortgage
$222,000
Outstanding Balance
$112,468
Interest Rate
5.7%
Mortgage Type
Purchase Money Mortgage
Estimated Equity
$614,372
Purchase Details
Closed on
Jan 22, 2003
Sold by
Plasencia Jose and Plasencia Irma
Bought by
Sanchez Luis
Home Financials for this Owner
Home Financials are based on the most recent Mortgage that was taken out on this home.
Original Mortgage
$220,000
Interest Rate
5.85%
Create a Home Valuation Report for This Property
The Home Valuation Report is an in-depth analysis detailing your home's value as well as a comparison with similar homes in the area
Home Values in the Area
Average Home Value in this Area
Purchase History
| Date | Buyer | Sale Price | Title Company |
|---|---|---|---|
| Solis Carmen | -- | None Available | |
| Sanchez Luis | -- | North American Title Co | |
| Sanchez Luis | $275,000 | Commonwealth Land Title Co |
Source: Public Records
Mortgage History
| Date | Status | Borrower | Loan Amount |
|---|---|---|---|
| Open | Sanchez Luis | $222,000 | |
| Closed | Sanchez Luis | $220,000 |
Source: Public Records
Tax History Compared to Growth
Tax History
| Year | Tax Paid | Tax Assessment Tax Assessment Total Assessment is a certain percentage of the fair market value that is determined by local assessors to be the total taxable value of land and additions on the property. | Land | Improvement |
|---|---|---|---|---|
| 2025 | $6,456 | $480,083 | $281,625 | $198,458 |
| 2024 | $6,233 | $470,670 | $276,103 | $194,567 |
| 2023 | $6,086 | $461,442 | $270,690 | $190,752 |
| 2022 | $5,796 | $452,395 | $265,383 | $187,012 |
| 2021 | $5,721 | $443,526 | $260,180 | $183,346 |
| 2020 | $5,764 | $438,980 | $257,513 | $181,467 |
| 2019 | $5,539 | $430,373 | $252,464 | $177,909 |
| 2018 | $5,406 | $421,935 | $247,514 | $174,421 |
| 2016 | $5,154 | $405,552 | $237,903 | $167,649 |
| 2015 | $5,071 | $399,461 | $234,330 | $165,131 |
| 2014 | $4,955 | $382,000 | $225,000 | $157,000 |
Source: Public Records
Map
Nearby Homes
- 8945 San Antonio Ave
- 9222 California Ave
- 8669 San Gabriel Ave
- 8991 Victoria Ave
- 8686 San Juan Ave
- 9529 San Juan Ave
- 9307 San Miguel Ave
- 9601 San Juan Ave
- 9534 Deeble St
- 3816 Liberty Blvd
- 8600 S Gate Ave
- 3175 Ohio Ave
- 9611 Mallison Ave
- 8963 Bowman Ave
- 9643 Mallison Ave
- 9308 Mcnerney Ave
- 8669 Cypress Ave
- 10016 California Ave
- 9320 Long Beach Blvd
- 8680 Evergreen Ave
- 8920 California Ave
- 8930 California Ave
- 8927 San Antonio Ave
- 8929 San Antonio Ave
- 8921 San Antonio Ave
- 8933 San Antonio Ave
- 8915 San Antonio Ave
- 8937 San Antonio Ave
- 8911 San Antonio Ave
- 8941 San Antonio Ave
- 8927 California Ave
- 8948 California Ave
- 8935 California Ave
- 8939 California Ave
- 8952 California Ave
- 8951 San Antonio Ave
- 8941 California Ave
- 8955 San Antonio Ave
- 8956 California Ave
- 3529 Firestone Blvd