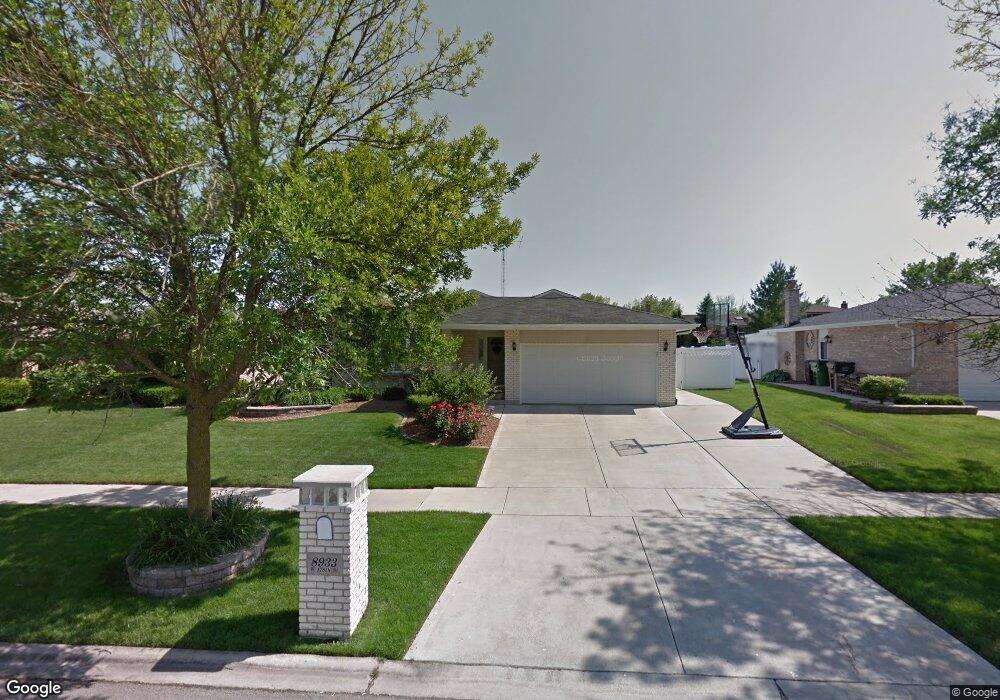
8933 178th St Tinley Park, IL 60487
Central Tinley Park NeighborhoodEstimated Value: $400,609 - $427,000
3
Beds
2
Baths
1,800
Sq Ft
$231/Sq Ft
Est. Value
About This Home
This home is located at 8933 178th St, Tinley Park, IL 60487 and is currently estimated at $415,652, approximately $230 per square foot. 8933 178th St is a home located in Cook County with nearby schools including Christa Mcauliffe School, Prairie View Middle School, and Victor J Andrew High School.
Ownership History
Date
Name
Owned For
Owner Type
Purchase Details
Closed on
Apr 20, 2001
Sold by
Michel Arthur and Nowak Frank
Bought by
Carter Joseph F and Carter Lynn
Current Estimated Value
Home Financials for this Owner
Home Financials are based on the most recent Mortgage that was taken out on this home.
Original Mortgage
$145,000
Outstanding Balance
$53,652
Interest Rate
7.07%
Estimated Equity
$362,000
Create a Home Valuation Report for This Property
The Home Valuation Report is an in-depth analysis detailing your home's value as well as a comparison with similar homes in the area
Home Values in the Area
Average Home Value in this Area
Purchase History
| Date | Buyer | Sale Price | Title Company |
|---|---|---|---|
| Carter Joseph F | $211,000 | -- |
Source: Public Records
Mortgage History
| Date | Status | Borrower | Loan Amount |
|---|---|---|---|
| Open | Carter Joseph F | $145,000 |
Source: Public Records
Tax History Compared to Growth
Tax History
| Year | Tax Paid | Tax Assessment Tax Assessment Total Assessment is a certain percentage of the fair market value that is determined by local assessors to be the total taxable value of land and additions on the property. | Land | Improvement |
|---|---|---|---|---|
| 2024 | $8,797 | $35,000 | $5,250 | $29,750 |
| 2023 | $7,185 | $35,000 | $5,250 | $29,750 |
| 2022 | $7,185 | $23,576 | $4,594 | $18,982 |
| 2021 | $6,985 | $23,574 | $4,593 | $18,981 |
| 2020 | $6,880 | $23,574 | $4,593 | $18,981 |
| 2019 | $7,195 | $25,614 | $4,156 | $21,458 |
| 2018 | $7,039 | $25,614 | $4,156 | $21,458 |
| 2017 | $6,870 | $25,614 | $4,156 | $21,458 |
| 2016 | $6,346 | $21,603 | $3,718 | $17,885 |
| 2015 | $6,236 | $21,603 | $3,718 | $17,885 |
| 2014 | $6,201 | $21,603 | $3,718 | $17,885 |
| 2013 | $6,861 | $25,346 | $3,718 | $21,628 |
Source: Public Records
Map
Nearby Homes
- 17533 Pecan Ln
- 17631 Dover Ct
- Fremont Plan at Radcliffe Place
- Calysta Plan at Radcliffe Place
- Danbury Plan at Radcliffe Place
- Briarcliffe Plan at Radcliffe Place
- Eden Plan at Radcliffe Place
- Amberwood Plan at Radcliffe Place
- 9280 Windsor Pkwy Unit 92
- 17964 Upland Dr
- 9201 175th St
- 9260 Windsor Pkwy Unit 80
- 18055 Upland Dr
- 9038 Mansfield Dr Unit 8
- 9051 Mansfield Dr Unit 1
- 17324 Humber Ln
- 17230 Shetland Dr
- 18248 Murphy Cir Unit 182
- 17535 S La Grange Rd
- 17535-2 Lagrange Rd