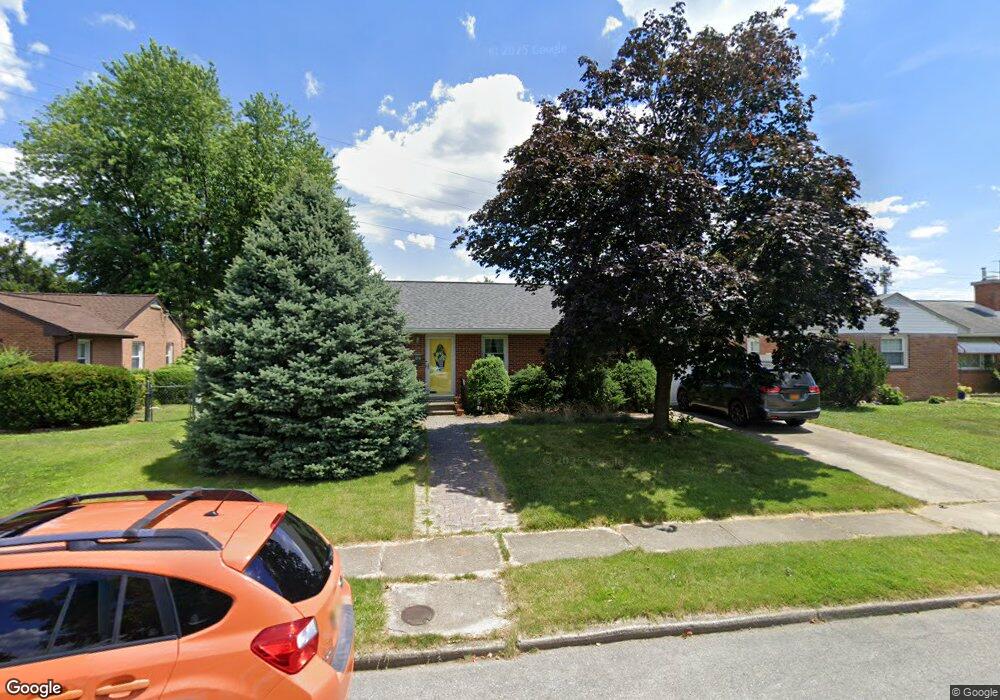
894 Pontiac Ave Frederick, MD 21701
Monocacy Village NeighborhoodEstimated Value: $372,742 - $419,000
--
Bed
2
Baths
1,120
Sq Ft
$353/Sq Ft
Est. Value
About This Home
This home is located at 894 Pontiac Ave, Frederick, MD 21701 and is currently estimated at $395,686, approximately $353 per square foot. 894 Pontiac Ave is a home located in Frederick County with nearby schools including North Frederick Elementary School, Gov. Thomas Johnson Middle School, and Gov. Thomas Johnson High School.
Ownership History
Date
Name
Owned For
Owner Type
Purchase Details
Closed on
May 2, 2007
Sold by
Rice Mary Margaret Sherald
Bought by
Wilkins Michael L and Wilkins Jennifer E
Current Estimated Value
Home Financials for this Owner
Home Financials are based on the most recent Mortgage that was taken out on this home.
Original Mortgage
$216,800
Outstanding Balance
$132,376
Interest Rate
6.24%
Mortgage Type
Stand Alone Second
Estimated Equity
$263,310
Purchase Details
Closed on
Dec 22, 2006
Sold by
Rice Mary Margaret Sherald
Bought by
Wilkins Michael L and Wilkins Jennifer E
Home Financials for this Owner
Home Financials are based on the most recent Mortgage that was taken out on this home.
Original Mortgage
$216,800
Interest Rate
6.24%
Mortgage Type
Stand Alone Second
Purchase Details
Closed on
Dec 12, 2000
Sold by
Kwasneski Marian J
Bought by
Rice Mary Margaret Sherald
Create a Home Valuation Report for This Property
The Home Valuation Report is an in-depth analysis detailing your home's value as well as a comparison with similar homes in the area
Home Values in the Area
Average Home Value in this Area
Purchase History
| Date | Buyer | Sale Price | Title Company |
|---|---|---|---|
| Wilkins Michael L | $271,000 | -- | |
| Wilkins Michael L | $271,000 | -- | |
| Rice Mary Margaret Sherald | -- | -- |
Source: Public Records
Mortgage History
| Date | Status | Borrower | Loan Amount |
|---|---|---|---|
| Open | Wilkins Michael L | $216,800 | |
| Previous Owner | Wilkins Michael L | $216,800 |
Source: Public Records
Tax History Compared to Growth
Tax History
| Year | Tax Paid | Tax Assessment Tax Assessment Total Assessment is a certain percentage of the fair market value that is determined by local assessors to be the total taxable value of land and additions on the property. | Land | Improvement |
|---|---|---|---|---|
| 2025 | $4,838 | $283,100 | $115,200 | $167,900 |
| 2024 | $4,838 | $266,933 | $0 | $0 |
| 2023 | $4,480 | $250,767 | $0 | $0 |
| 2022 | $4,251 | $234,600 | $103,400 | $131,200 |
| 2021 | $3,933 | $225,967 | $0 | $0 |
| 2020 | $3,933 | $217,333 | $0 | $0 |
| 2019 | $3,778 | $208,700 | $96,400 | $112,300 |
| 2018 | $3,785 | $207,233 | $0 | $0 |
| 2017 | $3,721 | $208,700 | $0 | $0 |
| 2016 | $3,377 | $204,300 | $0 | $0 |
| 2015 | $3,377 | $196,800 | $0 | $0 |
| 2014 | $3,377 | $189,300 | $0 | $0 |
Source: Public Records
Map
Nearby Homes