Estimated Value: $1,056,730 - $1,269,000
3
Beds
2
Baths
1,965
Sq Ft
$574/Sq Ft
Est. Value
About This Home
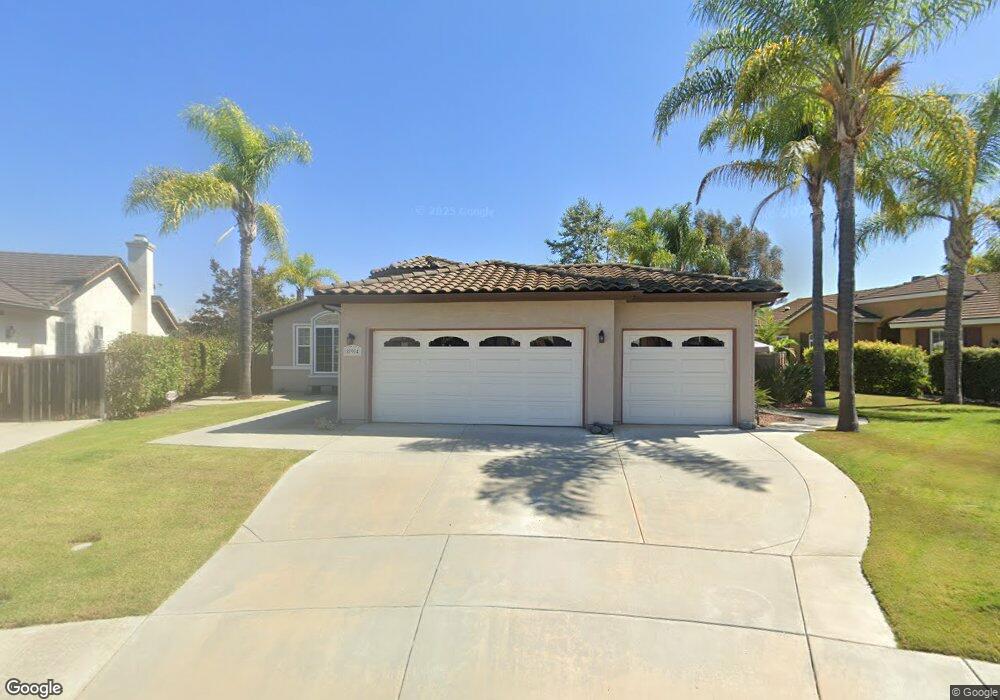
This home is located at 894 Via Allegra, Vista, CA 92081 and is currently estimated at $1,127,433, approximately $573 per square foot. 894 Via Allegra is a home located in San Diego County with nearby schools including Breeze Hill Elementary School, Madison Middle School, and Rancho Buena Vista High School.
Ownership History
Date
Name
Owned For
Owner Type
Purchase Details
Closed on
Aug 17, 2016
Sold by
Prior Frank E
Bought by
Crandall Timothy L and Crandall Leslye A
Current Estimated Value
Purchase Details
Closed on
May 19, 2015
Sold by
Duley William N
Bought by
Prior Frank E
Purchase Details
Closed on
May 24, 2006
Sold by
Harris Muriel G
Bought by
Duley William N
Home Financials for this Owner
Home Financials are based on the most recent Mortgage that was taken out on this home.
Original Mortgage
$500,000
Interest Rate
6.52%
Mortgage Type
Fannie Mae Freddie Mac
Purchase Details
Closed on
Mar 9, 2001
Sold by
Harris Muriel G
Bought by
Harris Muriel G
Purchase Details
Closed on
Nov 10, 2000
Sold by
Loma Verde Inc
Bought by
Harris Muriel G
Home Financials for this Owner
Home Financials are based on the most recent Mortgage that was taken out on this home.
Original Mortgage
$271,950
Interest Rate
7.13%
Create a Home Valuation Report for This Property
The Home Valuation Report is an in-depth analysis detailing your home's value as well as a comparison with similar homes in the area
Home Values in the Area
Average Home Value in this Area
Purchase History
| Date | Buyer | Sale Price | Title Company |
|---|---|---|---|
| Crandall Timothy L | $549,000 | Ticor Title La | |
| Prior Frank E | $467,000 | None Available | |
| Duley William N | $627,500 | First American Title Co | |
| Harris Muriel G | -- | -- | |
| Harris Muriel G | $340,000 | First American Title |
Source: Public Records
Mortgage History
| Date | Status | Borrower | Loan Amount |
|---|---|---|---|
| Previous Owner | Duley William N | $500,000 | |
| Previous Owner | Harris Muriel G | $271,950 |
Source: Public Records
Tax History Compared to Growth
Tax History
| Year | Tax Paid | Tax Assessment Tax Assessment Total Assessment is a certain percentage of the fair market value that is determined by local assessors to be the total taxable value of land and additions on the property. | Land | Improvement |
|---|---|---|---|---|
| 2025 | $7,484 | $637,153 | $375,198 | $261,955 |
| 2024 | $7,484 | $624,661 | $367,842 | $256,819 |
| 2023 | $7,320 | $612,414 | $360,630 | $251,784 |
| 2022 | $7,302 | $600,407 | $353,559 | $246,848 |
| 2021 | $7,140 | $588,635 | $346,627 | $242,008 |
| 2020 | $7,103 | $582,600 | $343,073 | $239,527 |
| 2019 | $7,001 | $571,178 | $336,347 | $234,831 |
| 2018 | $6,687 | $559,979 | $329,752 | $230,227 |
| 2017 | $6,575 | $549,000 | $323,287 | $225,713 |
| 2016 | $5,732 | $467,000 | $275,000 | $192,000 |
| 2015 | $4,609 | $359,242 | $188,682 | $170,560 |
| 2014 | $4,500 | $352,205 | $184,986 | $167,219 |
Source: Public Records
Map
Nearby Homes
- 1037 Buena Vista Dr Unit 37
- 1047 Buena Vista Dr Unit 47
- 754 Rocking Horse Rd
- 915 Crest View Rd
- 880 Crest View Rd
- 1336 Lupine Hills Dr
- 1207 Branding Iron Cir
- 1292 Sunset Dr
- 1098 Vale View Dr
- 869 Phillips St
- 1701 Hilo Dr
- 1553 Mallorca Dr
- 1145 Tower Place
- 1449 Genoa Dr
- 1234 Lupine Hills Dr
- 1140 Tower Dr
- 1879 Maya Ct
- 840 Sinkler Way
- 902 Presidio Way
- 730 Breeze Hill Rd Unit 300
- 890 Via Allegra
- 1057 Via Carina
- 1061 Via Carina
- 897 Via Allegra
- 891 Via Allegra
- 1053 Via Carina
- 884 Via Allegra
- 926 Sunset Dr
- 885 Via Allegra
- 1049 Via Carina
- 1060 Via Carina
- 918 Sunset Dr
- 1054 Via Carina
- 878 Via Allegra
- 879 Via Allegra
- 936 Sunset Dr
- 1016 Via Reata
- 1010 Via Reata
- 1020 Via Reata
- 916 Sunset Dr