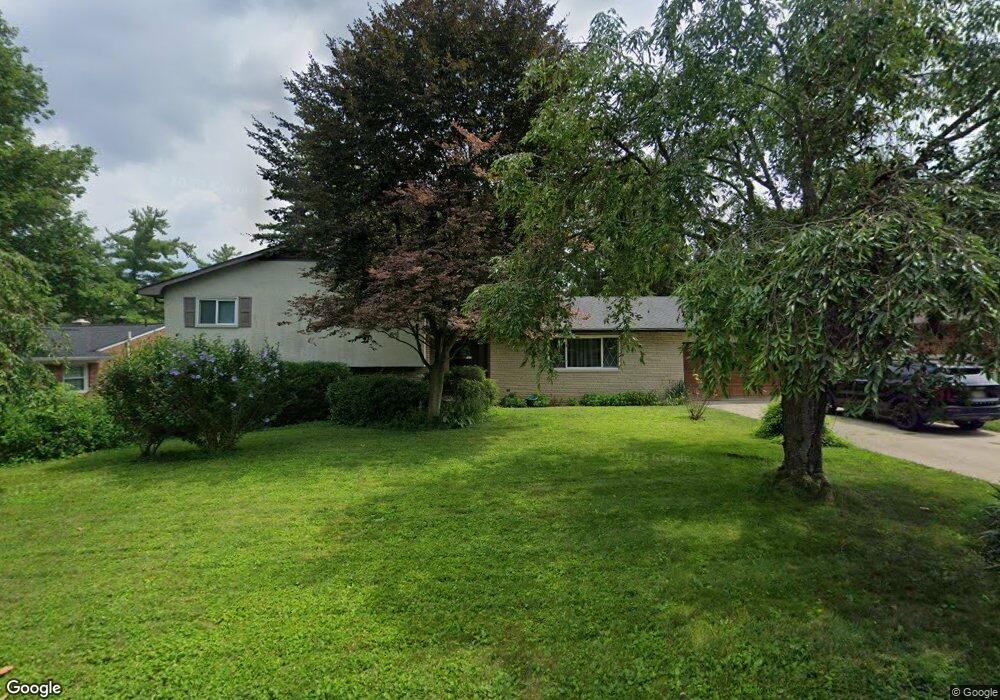
895 Greenridge Rd Columbus, OH 43235
Indian Hills NeighborhoodEstimated Value: $441,524 - $499,000
4
Beds
3
Baths
2,321
Sq Ft
$201/Sq Ft
Est. Value
About This Home
This home is located at 895 Greenridge Rd, Columbus, OH 43235 and is currently estimated at $466,881, approximately $201 per square foot. 895 Greenridge Rd is a home located in Franklin County with nearby schools including Gables Elementary School, Ridgeview Middle School, and Centennial High School.
Ownership History
Date
Name
Owned For
Owner Type
Purchase Details
Closed on
Feb 28, 2007
Sold by
Pazzelli Derrek and Pazzelli Derek
Bought by
Hart William D and Hart Alina
Current Estimated Value
Home Financials for this Owner
Home Financials are based on the most recent Mortgage that was taken out on this home.
Original Mortgage
$182,000
Outstanding Balance
$110,222
Interest Rate
6.27%
Mortgage Type
Purchase Money Mortgage
Estimated Equity
$356,659
Purchase Details
Closed on
Sep 29, 2004
Sold by
Aeh Lowell D and Aeh Phyllis
Bought by
Pazzelli Derrek
Purchase Details
Closed on
Feb 13, 1995
Sold by
Brewster Bernie F
Bought by
Aeh Lowell D Aeh and Aeh Phyllis
Home Financials for this Owner
Home Financials are based on the most recent Mortgage that was taken out on this home.
Original Mortgage
$135,000
Interest Rate
6.75%
Mortgage Type
New Conventional
Purchase Details
Closed on
Jul 1, 1985
Create a Home Valuation Report for This Property
The Home Valuation Report is an in-depth analysis detailing your home's value as well as a comparison with similar homes in the area
Home Values in the Area
Average Home Value in this Area
Purchase History
| Date | Buyer | Sale Price | Title Company |
|---|---|---|---|
| Hart William D | $227,500 | Attorney | |
| Pazzelli Derrek | $189,000 | Chicago Tit | |
| Aeh Lowell D Aeh | $150,000 | -- | |
| -- | $71,000 | -- |
Source: Public Records
Mortgage History
| Date | Status | Borrower | Loan Amount |
|---|---|---|---|
| Open | Hart William D | $182,000 | |
| Previous Owner | Aeh Lowell D Aeh | $135,000 |
Source: Public Records
Tax History Compared to Growth
Tax History
| Year | Tax Paid | Tax Assessment Tax Assessment Total Assessment is a certain percentage of the fair market value that is determined by local assessors to be the total taxable value of land and additions on the property. | Land | Improvement |
|---|---|---|---|---|
| 2024 | $5,448 | $121,390 | $52,400 | $68,990 |
| 2023 | $5,378 | $121,380 | $52,395 | $68,985 |
| 2022 | $4,949 | $95,420 | $32,800 | $62,620 |
| 2021 | $4,958 | $95,420 | $32,800 | $62,620 |
| 2020 | $4,964 | $95,420 | $32,800 | $62,620 |
| 2019 | $4,587 | $75,610 | $26,220 | $49,390 |
| 2018 | $4,491 | $75,610 | $26,220 | $49,390 |
| 2017 | $4,584 | $75,610 | $26,220 | $49,390 |
| 2016 | $4,853 | $73,260 | $21,390 | $51,870 |
| 2015 | $4,405 | $73,260 | $21,390 | $51,870 |
| 2014 | $4,416 | $73,260 | $21,390 | $51,870 |
| 2013 | $2,074 | $69,755 | $20,370 | $49,385 |
Source: Public Records
Map
Nearby Homes
- 838 Cambridge Ct
- 5881 Rocky Rill Rd
- 6041 Rocky Rill Rd
- 5854 Aqua Bay Dr Unit 5854
- 5936 Aqua Bay Dr
- 5938 Aqua Bay Dr
- 895 Linworth Village Dr
- 928 Linworth Village Dr
- 5773 Middlefield Dr
- 6105 Flora Villa Dr
- 511 W Kanawha Ave
- 301 W Riverglen Dr
- 1246 Southport Dr
- 1505 Eastmeadow Place
- 290 W Kanawha Ave
- 409 Fenway Rd
- 1213 Nantucket Ave
- 1037 Ravine Ridge Dr
- 252 W Kanawha Ave
- 162 Broad Meadows Blvd
- 905 Greenridge Rd
- 875 Greenridge Rd
- 861 Skylark Ln
- 915 Greenridge Rd
- 905 Stoney Creek Rd
- 900 Greenridge Rd
- 892 Greenridge Rd
- 910 Greenridge Rd
- 859 Greenridge Rd
- 855 Skylark Ln
- 880 Greenridge Rd
- 860 Skylark Ln
- 920 Greenridge Rd
- 870 Greenridge Rd
- 845 Greenridge Rd
- 907 Stoney Creek Rd
- 860 Greenridge Rd
- 930 Greenridge Rd
- 849 Skylark Ln
- 933 Greenridge Rd