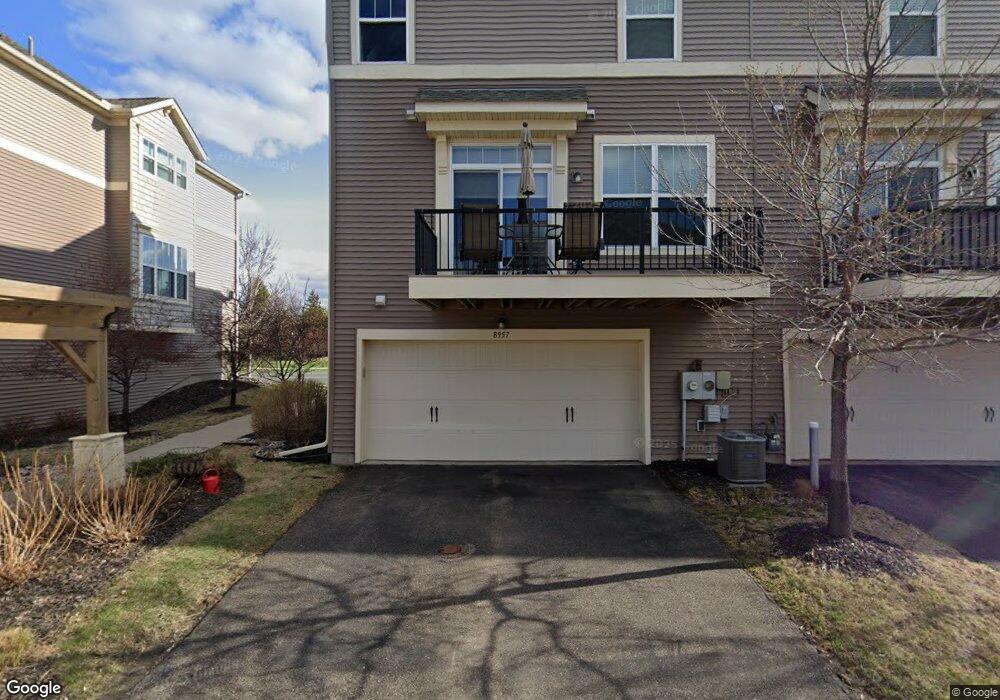
8957 SW Village Loop Chanhassen, MN 55317
Estimated Value: $428,663 - $462,000
3
Beds
2
Baths
1,988
Sq Ft
$223/Sq Ft
Est. Value
About This Home
This home is located at 8957 SW Village Loop, Chanhassen, MN 55317 and is currently estimated at $442,916, approximately $222 per square foot. 8957 SW Village Loop is a home with nearby schools including Chanhassen Elementary School, Pioneer Ridge Middle School, and Chanhassen High School.
Ownership History
Date
Name
Owned For
Owner Type
Purchase Details
Closed on
Aug 4, 2025
Sold by
Casanova Elaine Mary and Elaine Casanova Revocable Intervivos Tru
Bought by
Casanova Todd Joseph
Current Estimated Value
Purchase Details
Closed on
Jul 31, 2025
Sold by
Casanova Elaine Mary and Elaine Casanova Revocable Intervivos Tru
Bought by
Casanova Todd Joseph
Purchase Details
Closed on
May 31, 2016
Sold by
Casanova Grant Joseph and Casanova Elaine
Bought by
Casanova Elaine and Elaine Casanova Revocable Intervivos Tru
Purchase Details
Closed on
Sep 26, 2014
Sold by
The Ryland Group Inc
Bought by
Casanova Joseph and Revoca Casanova Revoca
Home Financials for this Owner
Home Financials are based on the most recent Mortgage that was taken out on this home.
Original Mortgage
$205,590
Interest Rate
4.2%
Create a Home Valuation Report for This Property
The Home Valuation Report is an in-depth analysis detailing your home's value as well as a comparison with similar homes in the area
Home Values in the Area
Average Home Value in this Area
Purchase History
| Date | Buyer | Sale Price | Title Company |
|---|---|---|---|
| Casanova Todd Joseph | $500 | None Listed On Document | |
| Casanova Todd Joseph | $500 | None Listed On Document | |
| Casanova Elaine | -- | Attorney | |
| Casanova Joseph | $297,984 | Ryland Title Company | |
| Casanova Grant Grant | $298,000 | -- |
Source: Public Records
Mortgage History
| Date | Status | Borrower | Loan Amount |
|---|---|---|---|
| Previous Owner | Casanova Grant Grant | $205,590 | |
| Previous Owner | Casanova Joseph | $208,590 |
Source: Public Records
Tax History Compared to Growth
Tax History
| Year | Tax Paid | Tax Assessment Tax Assessment Total Assessment is a certain percentage of the fair market value that is determined by local assessors to be the total taxable value of land and additions on the property. | Land | Improvement |
|---|---|---|---|---|
| 2025 | $4,070 | $407,000 | $110,400 | $296,600 |
| 2024 | $4,390 | $400,600 | $110,400 | $290,200 |
| 2023 | $4,348 | $426,100 | $115,000 | $311,100 |
| 2022 | $4,144 | $426,000 | $111,800 | $314,200 |
| 2021 | $3,830 | $341,400 | $93,200 | $248,200 |
| 2020 | $3,736 | $326,200 | $93,200 | $233,000 |
| 2019 | $3,684 | $308,800 | $88,700 | $220,100 |
| 2018 | $3,688 | $308,800 | $88,700 | $220,100 |
| 2017 | $3,720 | $301,200 | $88,700 | $212,500 |
| 2016 | $3,668 | $265,900 | $0 | $0 |
| 2015 | -- | $34,500 | $0 | $0 |
| 2014 | -- | $36,400 | $0 | $0 |
Source: Public Records
Map
Nearby Homes
- 8973 SW Village Loop
- 8933 SW Village Loop
- 600 Lyman Blvd
- 763 Stonegate Rd
- 441 Lyman Blvd
- TBD County Road 101
- 732 Wildflower Ln
- 513 Mission Hills Way W
- 742 Maggie Way
- 420 Monk Ct
- 9235 Lake Riley Blvd
- Mississippi Plan at Foxwood - West Collection
- Harriet Plan at Foxwood - West Collection
- 9511 Eagle Ridge Rd
- Vermillion Plan at Foxwood - West Collection
- Benton Plan at Foxwood - West Collection
- Fremont Plan at Foxwood - West Collection
- Pepin Plan at Foxwood - West Collection
- Nokomis Plan at Foxwood - West Collection
- St. Croix Plan at Foxwood - West Collection
- 8959 SW Village Loop
- 8961 SW Village Loop
- 8955 SW Village Loop
- 8953 SW Village Loop
- 8963 SW Village Loop
- 8965 SW Village Loop
- 8972 SW Village Loop
- 8951 SW Village Loop
- 8967 SW Village Loop
- 8942 SW Village Loop
- 8974 SW Village Loop
- 8969 SW Village Loop
- 8947 SW Village Loop
- 8976 SW Village Loop
- 8940 SW Village Loop
- 8971 SW Village Loop
- 8938 SW Village Loop
- 8978 SW Village Loop
- 8936 SW Village Loop
- 8975 SW Village Loop