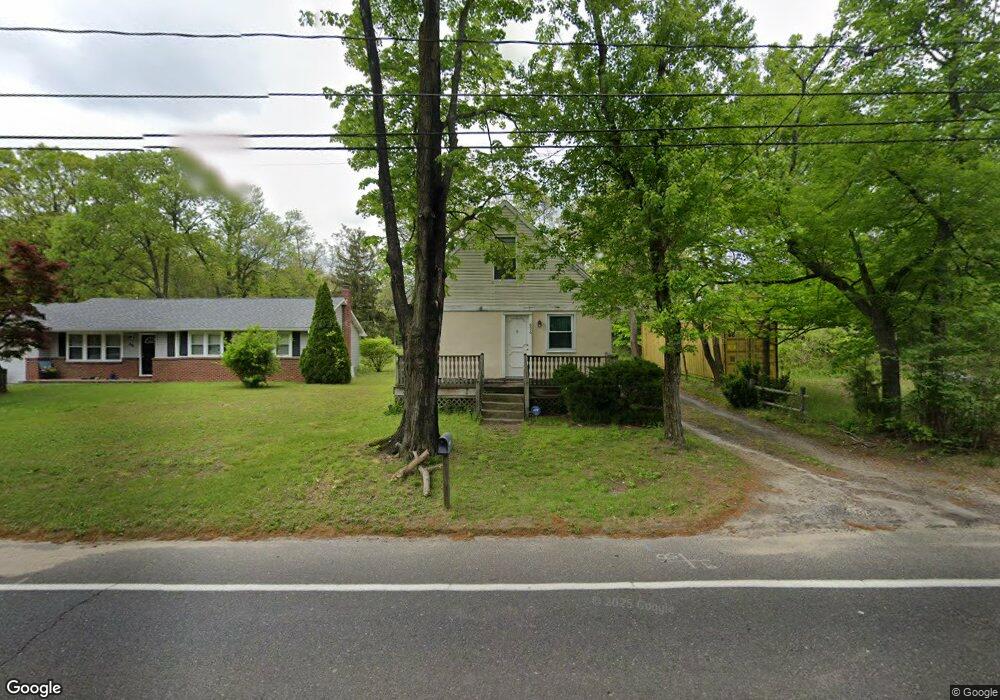
896 Tanyard Rd Woodbury, NJ 08096
Deptford Township NeighborhoodEstimated Value: $250,840 - $318,000
--
Bed
--
Bath
1,170
Sq Ft
$252/Sq Ft
Est. Value
About This Home
This home is located at 896 Tanyard Rd, Woodbury, NJ 08096 and is currently estimated at $294,460, approximately $251 per square foot. 896 Tanyard Rd is a home located in Gloucester County with nearby schools including Deptford Township High School, St Margaret Regional School, and Holy Angels Catholic School.
Ownership History
Date
Name
Owned For
Owner Type
Purchase Details
Closed on
Oct 23, 2000
Sold by
Residential Funding Corp
Bought by
Becker Howard L and Vasilakis Becker Kathleen A
Current Estimated Value
Home Financials for this Owner
Home Financials are based on the most recent Mortgage that was taken out on this home.
Original Mortgage
$59,850
Outstanding Balance
$21,686
Interest Rate
7.83%
Estimated Equity
$272,774
Purchase Details
Closed on
Oct 9, 2000
Sold by
Chase Manhattan Mtg Corp
Bought by
Residential Funding Corp
Home Financials for this Owner
Home Financials are based on the most recent Mortgage that was taken out on this home.
Original Mortgage
$59,850
Outstanding Balance
$21,686
Interest Rate
7.83%
Estimated Equity
$272,774
Purchase Details
Closed on
Aug 6, 1999
Sold by
Skerrett Juan A
Bought by
The Chase Manhattan Bank
Purchase Details
Closed on
Sep 30, 1994
Sold by
Junction I Builders
Bought by
Skerrett Juan A
Create a Home Valuation Report for This Property
The Home Valuation Report is an in-depth analysis detailing your home's value as well as a comparison with similar homes in the area
Home Values in the Area
Average Home Value in this Area
Purchase History
| Date | Buyer | Sale Price | Title Company |
|---|---|---|---|
| Becker Howard L | $63,000 | -- | |
| Residential Funding Corp | -- | -- | |
| The Chase Manhattan Bank | -- | -- | |
| Skerrett Juan A | $76,500 | -- |
Source: Public Records
Mortgage History
| Date | Status | Borrower | Loan Amount |
|---|---|---|---|
| Open | Becker Howard L | $59,850 |
Source: Public Records
Tax History Compared to Growth
Tax History
| Year | Tax Paid | Tax Assessment Tax Assessment Total Assessment is a certain percentage of the fair market value that is determined by local assessors to be the total taxable value of land and additions on the property. | Land | Improvement |
|---|---|---|---|---|
| 2025 | $3,761 | $104,900 | $24,400 | $80,500 |
| 2024 | $3,640 | $104,900 | $24,400 | $80,500 |
| 2023 | $3,640 | $104,900 | $24,400 | $80,500 |
| 2022 | $3,614 | $104,900 | $24,400 | $80,500 |
| 2021 | $3,562 | $104,900 | $24,400 | $80,500 |
| 2020 | $3,521 | $104,900 | $24,400 | $80,500 |
| 2019 | $3,454 | $104,900 | $24,400 | $80,500 |
| 2018 | $3,377 | $104,900 | $24,400 | $80,500 |
| 2017 | $3,287 | $104,900 | $24,400 | $80,500 |
| 2016 | $3,219 | $104,900 | $24,400 | $80,500 |
| 2015 | $3,120 | $104,900 | $24,400 | $80,500 |
| 2014 | $3,039 | $104,900 | $24,400 | $80,500 |
Source: Public Records
Map
Nearby Homes
- 10 Carter Dr
- 853 Mail Ave
- 805 Cattell Rd
- 859 Cattell Rd
- 106 Shelly Ln
- 41 Fleming Ave
- 760 Woodland Ave
- 1573 Delsea Dr
- 735 Chestnut Ave
- 183 Lincoln Rd
- 1845 Delsea Dr
- 1159 Glassboro Rd
- 134 Carver Dr
- 760 Highland Ave
- 616 Fairview Ave
- 617 Stratford Ave
- 14 Laurel Ct
- 106 Bock Ave
- 133 Hampshire Dr
- 951 New Jersey Ave