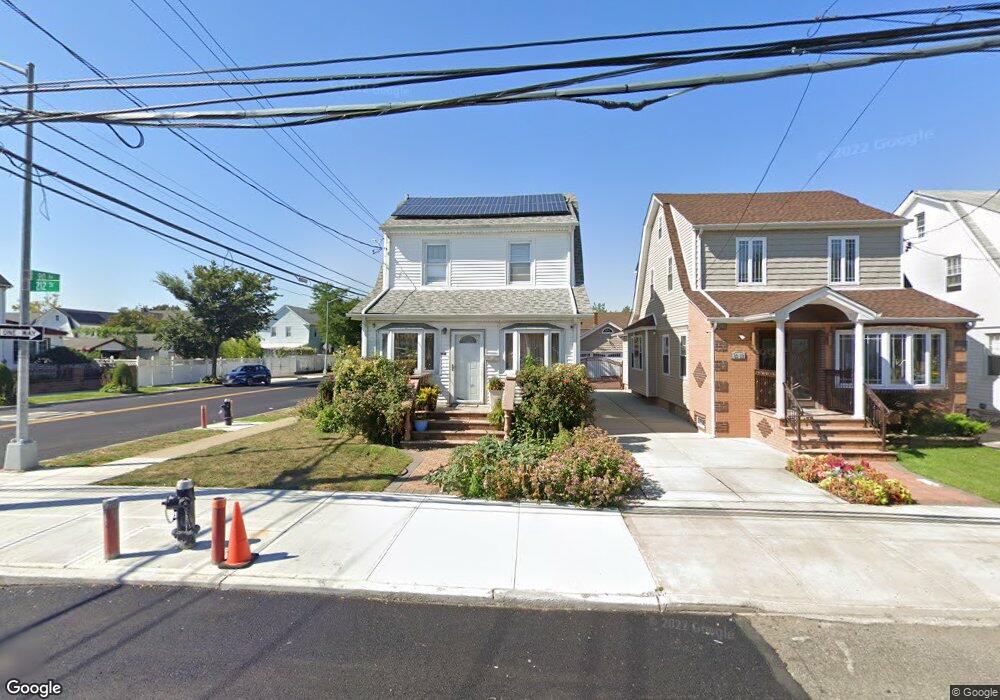
8990 212th St Queens Village, NY 11427
Queens Village NeighborhoodEstimated Value: $774,000 - $852,000
--
Bed
--
Bath
1,770
Sq Ft
$455/Sq Ft
Est. Value
About This Home
This home is located at 8990 212th St, Queens Village, NY 11427 and is currently estimated at $805,098, approximately $454 per square foot. 8990 212th St is a home located in Queens County with nearby schools including P.S. 33 Edward M. Funk, Jean Nuzzi Intermediate School, and Incarnation Catholic Academy.
Ownership History
Date
Name
Owned For
Owner Type
Purchase Details
Closed on
Jul 10, 2020
Sold by
Khan Nazir Ahmad
Bought by
Khan Bibi Farina and Khan Nazir Ahmad
Current Estimated Value
Home Financials for this Owner
Home Financials are based on the most recent Mortgage that was taken out on this home.
Original Mortgage
$180,000
Outstanding Balance
$159,612
Interest Rate
3.1%
Mortgage Type
New Conventional
Estimated Equity
$645,486
Purchase Details
Closed on
Aug 9, 2001
Sold by
Romero Nellie
Bought by
Khan Nazir Ahmad
Home Financials for this Owner
Home Financials are based on the most recent Mortgage that was taken out on this home.
Original Mortgage
$172,000
Interest Rate
6.89%
Purchase Details
Closed on
Jun 23, 1999
Sold by
Romero Nellie and Estate Of Vera Gutter
Bought by
Romero Nellie
Create a Home Valuation Report for This Property
The Home Valuation Report is an in-depth analysis detailing your home's value as well as a comparison with similar homes in the area
Home Values in the Area
Average Home Value in this Area
Purchase History
| Date | Buyer | Sale Price | Title Company |
|---|---|---|---|
| Khan Bibi Farina | -- | -- | |
| Khan Bibi Farina | -- | -- | |
| Khan Nazir Ahmad | -- | -- | |
| Khan Nazir Ahmad | -- | -- | |
| Romero Nellie | -- | -- | |
| Romero Nellie | -- | -- |
Source: Public Records
Mortgage History
| Date | Status | Borrower | Loan Amount |
|---|---|---|---|
| Open | Khan Bibi Farina | $180,000 | |
| Closed | Khan Bibi Farina | $180,000 | |
| Previous Owner | Khan Nazir Ahmad | $172,000 |
Source: Public Records
Tax History Compared to Growth
Tax History
| Year | Tax Paid | Tax Assessment Tax Assessment Total Assessment is a certain percentage of the fair market value that is determined by local assessors to be the total taxable value of land and additions on the property. | Land | Improvement |
|---|---|---|---|---|
| 2025 | $6,278 | $32,659 | $9,763 | $22,896 |
| 2024 | $6,290 | $32,659 | $11,336 | $21,323 |
| 2023 | $6,076 | $31,649 | $10,225 | $21,424 |
| 2022 | $5,674 | $40,920 | $15,120 | $25,800 |
| 2021 | $5,775 | $39,900 | $15,120 | $24,780 |
| 2020 | $5,465 | $34,320 | $15,120 | $19,200 |
| 2019 | $5,400 | $34,260 | $15,120 | $19,140 |
| 2018 | $5,079 | $26,374 | $9,949 | $16,425 |
| 2017 | $4,773 | $24,883 | $12,719 | $12,164 |
| 2016 | $4,496 | $24,883 | $12,719 | $12,164 |
| 2015 | $2,611 | $22,680 | $16,800 | $5,880 |
| 2014 | $2,611 | $22,680 | $16,800 | $5,880 |
Source: Public Records
Map
Nearby Homes
- 9022 Hollis Court Blvd
- 91-03 212th St
- 89-38 212th St
- 8935 210th Place
- 88-52 212th St
- 88-49 212th Place
- 89-16 214th St
- 8821 Hollis Court Blvd
- 9013 209th St
- 9001 215th St
- 213-14 Hillside Ave
- 21014 Hillside Ave
- 89-09 215th St
- 88-20 215th St
- 89-91 215th Place
- 90-60 209th St
- 90-54 209th St
- 215 E 89th St Unit 2B
- 214-32 Hillside Ave
- 212-52 Whitehall Terrace
- 8988 212th St
- 89-88 212th St
- 8984 212th St
- 8980 212th St
- 21160 90th Ave
- 8989 Hollis Court Blvd
- 89-85 Hollis Court Blvd
- 8985 Hollis Court Blvd
- 8976 212th St
- 8981 Hollis Court Blvd
- 89-89 Hollis Court Blvd
- 9008 212th St
- 89-81 Hollis Court Blvd
- 8979 Hollis Court Blvd
- 8974 212th St
- 9001 Hollis Court Blvd
- 90-01 Hollis Court Blvd
- 8989 212th St
- 8987 212th St
- 8985 212th St